











Market Analysis

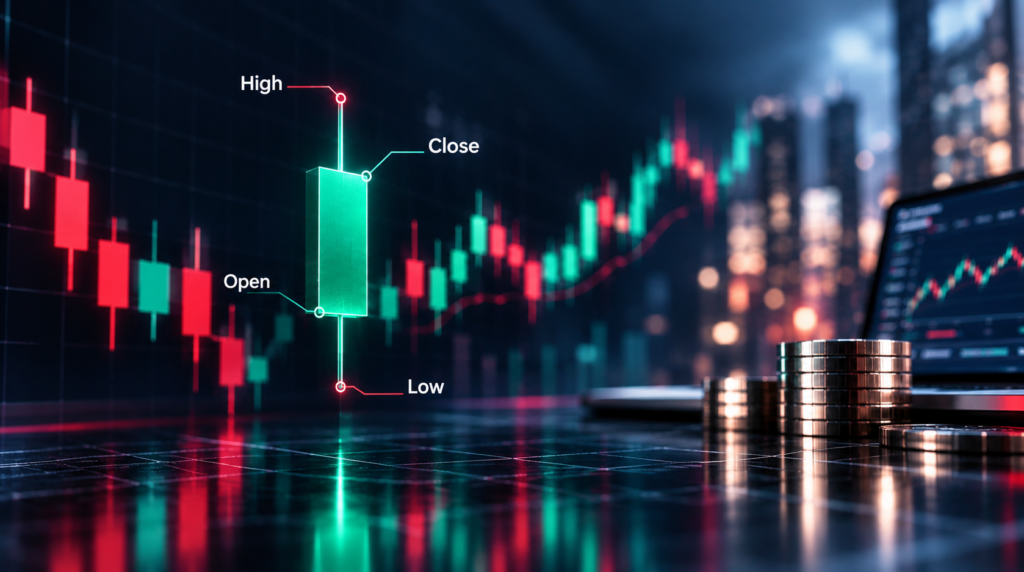
Why the Closing Price Matters: Where Did the Session Finish?
Technical Analysis

The closing price shows where a trading session ends, but it may differ significantly from the highest or lowest price reached. Learn how to identify the close on a candlestick chart and interpret it using a real-world gold example.

Read More
View More

Market News

US Inflation Report Looms as Markets Bet on Fed Pause

Oct 14, 2026

US Inflation Report Looms as Markets Bet on Fed Pause

US inflation is expected to accelerate in September, with annual CPI forecast to reach 3.6%. Markets are still betting on a Federal Reserve pause in October as investors assess the outlook for interest rates, the US dollar and Treasury yields.

Read More
Fed Minutes in Focus as Markets Price Higher Chance of October Pause

Oct 07, 2026

Fed Minutes in Focus as Markets Price Higher Chance of October Pause

Federal Reserve meeting minutes are in focus as markets increasingly expect rates to remain unchanged in October. Softer US jobs data has helped reduce expectations for another immediate rate increase.

Read More
Q3 2026 Market Review: Oil, Inflation and Higher Rates Reshape Global Markets

Oct 07, 2026

Q3 2026 Market Review: Oil, Inflation and Higher Rates Reshape Global Markets

Global markets faced a changing backdrop in Q3 2026 as oil prices surged, inflation pressures returned and bond yields moved higher. Explore the quarter's performance across equities, sectors, fixed income, commodities and currencies.

Read More
Oil Falls Below $100 as Supply Fears Ease and Markets Reassess Inflation Risk

Sep 23, 2026

Oil Falls Below $100 as Supply Fears Ease and Markets Reassess Inflation Risk

Brent crude has fallen below $100 a barrel as improving Gulf supply prospects and hopes for US-Iran diplomacy ease some supply concerns. Markets are now assessing what lower oil prices could mean for inflation, interest rates and the wider market outlook.

Read More
Markets Brace for Fed Rate Decision as UK Inflation Adds to Rate Concerns

Sep 16, 2026

Markets Brace for Fed Rate Decision as UK Inflation Adds to Rate Concerns

Markets are bracing for the Federal Reserve's September rate decision as a 25-basis-point increase becomes heavily priced. Rising UK inflation, oil above $100 and US Treasury yields above 5% are adding to the focus on global interest rates.

Read More
View More

Educational

How Professional Investors Think

Oct 22, 2026

How Professional Investors Think

Discover how professional investors approach uncertainty, manage risk and make investment decisions. Explore eight principles covering probabilities, discipline, diversification and long-term thinking.

Read More
View More

Company News

EC Markets Named Forex Broker of the Year at Money Expo Argentina 2026

Oct 05, 2026

EC Markets Named Forex Broker of the Year at Money Expo Argentina 2026

We were named Forex Broker of the Year at Money Expo Argentina 2026. From live sessions to conversations at Booth #15, take a look back at two packed days in Buenos Aires.

Read More
View More

Videos

General

How To Create and Use an EC Markets Demo Account
General

Before you start trading with real money on the line, it’s always a good idea to get familiar with your trading software and practice any trading strategies on an EC Markets demo account. A demo account is an account type offered by most brokers that enables traders to make trades entirely with artificial currency, so that there are no real losses (or profit) from trading outcomes. As a result, this is an essential tool that both experienced and new traders use to test new strategies before jumping into the real market.

Read More
View More

Latest News

Fundamental Analysis

Oct 13, 2026

Pricing Power Explained: What It Reveals About a Company

Pricing power can reveal important information about a company's competitive position and ability to manage rising costs. Learn how investors assess pricing power through sales volumes, revenue and profit margins, with Coca-Cola as a real-world example.

See More
Weekly Recap

Oct 12, 2026

US Stocks Rise as AI Optimism Meets Inflation Pressures | Weekly Recap: 5-9 October 2026

US equities reached record highs during the week ending 9 October 2026, supported by AI optimism and resilient economic data. However, rising oil prices, volatile Treasury yields and persistent inflation concerns kept investors selective, with Energy leading global sector performance.

See More
Educational

Oct 08, 2026

Sector Rotation Explained: How Market Leadership Changes

Sector rotation explains why different industries can outperform or underperform as economic conditions change. Explore cyclical and defensive sectors, economic cycles and the factors that influence stock market leadership.

See More
Market Analysis

Oct 07, 2026

Williams %R Indicator Explained: How It Measures Price Momentum

The Williams %R indicator shows where the current closing price sits within its recent trading range. Learn how Williams %R is calculated, how to interpret its scale and what overbought and oversold readings can mean.

See More
Fundamental Analysis

Oct 06, 2026

High Dividend Yield: Why It Is Not Always a Good Sign

A high dividend yield can look attractive, but a rising yield may also result from a falling share price. Learn how dividend sustainability, cash flow, payout ratios and debt can provide important context.

See More
Weekly Recap

Oct 05, 2026

US Jobs Slow as Inflation Persists and Bond Yields Surge | Weekly Recap: 28 September-2 October 2026 

US employment slowed during the week ending 2 October 2026, reducing expectations for another Fed rate increase as inflation remained elevated. Treasury yields reached multi-decade highs, the US dollar strengthened and gold declined.

See More
Educational

Oct 01, 2026

Discounted Cash Flow (DCF): How DCF Valuation Works

Discounted Cash Flow (DCF) is a widely used method for estimating the value of a business based on its expected future cash flows. Learn how DCF works, why future cash is discounted and how analysts estimate intrinsic value.

See More
Technical Analysis

Sep 30, 2026

Rate of Change (ROC) Explained: How the Indicator Measures Momentum

The Rate of Change indicator measures the percentage change in price over a selected period. Learn how ROC is calculated, how to interpret positive and negative readings and how it can provide context about market momentum.

See More

Don’t just read the market.
Trade it!

Start Trading

Trading is risky. Proceed wisely.