














Pricing Power Explained: What It Reveals About a Company


Pricing power is a company’s ability to raise prices without significantly reducing demand. Learn what it reveals about competitive strength, revenue growth and profitability, using Coca-Cola as a real-world example.
A company’s ability to raise prices without losing substantial demand can reveal important information about its competitive position.
This ability is known as pricing power. It may indicate that customers value the company’s products, recognise its brand or have few attractive alternatives. However, higher prices do not automatically lead to higher profits. Investors must also consider sales volumes, operating costs and changes in the company’s business mix.
What Is Pricing Power?
Pricing power is the ability to increase prices while maintaining a relatively stable level of demand.
Consider a simplified company that sells one million products for £10 each, generating £10 million in revenue. If it raises the price to £11 and still sells approximately one million products, revenue increases to £11 million. This suggests that customers were willing to accept the higher price.
However, if the company raises its price to £11 but sales fall to 700,000 products, revenue declines to £7.7 million. The company raised its price but did not generate more revenue because it lost too much volume.
This is a simplified hypothetical example for educational purposes only and does not represent an actual company.
Why Does Pricing Power Matter?
Strong pricing power can help a company protect its revenue and profit margins when wages, raw materials, transportation or other expenses increase.
Businesses with limited pricing power may be forced to absorb higher costs. If they increase prices, customers may switch to competitors or reduce their purchases. If they keep prices unchanged, their profit margins may decline.
Pricing power can come from several sources. A recognisable brand may encourage customer loyalty, while a unique product may have few direct alternatives. Patents, network effects, regulation or high switching costs may also strengthen a company’s position.
However, pricing power has limits. Even loyal customers may purchase less, choose smaller packages or move to cheaper alternatives if prices rise too far.
How Can Investors Assess Pricing Power?
No single financial figure provides a complete measure of pricing power. Investors may instead examine several financial measures alongside management commentary.
Revenue growth accompanied by stable sales volumes can suggest that customers have accepted higher prices. Stable or improving profit margins may indicate that the company has passed higher costs to customers successfully.
Some companies report a measure known as price and mix. This combines the effects of direct price changes with shifts between products, package sizes, sales channels and geographical markets. A positive price and mix figure does not therefore represent price increases alone.
Market share can provide further context. A company may increase prices and maintain revenue while losing customers to competitors. Comparing its performance with the wider industry can help distinguish genuine pricing strength from temporary increases in selling prices.
Coca-Cola: How Pricing Power Affects Revenue and Volume
Coca-Cola provides a useful example of how pricing, volume and revenue can interact.
In 2022 and 2023, price and mix rose 11% and 10% respectively, alongside volume growth of 5% and 2%.
Coca-Cola continued to report strong price and mix growth in 2024. Price and mix increased by 11%, while unit case volume rose by 1%. Reported net revenue increased by 3% to $47.1 billion, and organic revenue increased by 12%.
In 2025, price and mix increased by 4%, while unit case volume was unchanged. Reported net revenue rose by 2% to $47.9 billion, and organic revenue increased by 5%. Price and mix therefore contributed less to growth than in the previous three years, while unit case volume remained flat.
These figures are consistent with pricing power, but they do not prove that Coca-Cola can raise prices indefinitely. Price and mix includes factors beyond direct price increases. Its growth slowed to 4% in 2025 after reaching 10% or 11% in each year from 2022 to 2024, showing that the contribution from pricing can change as economic conditions and consumer behaviour develop.
Why Pricing Power Does Not Always Lead to Higher Profits
Higher prices can support profitability, but other expenses may still prevent reported margins from improving.
Coca-Cola’s reported operating margin declined from 24.7% in 2023 to 21.2% in 2024. However, its comparable operating margin, which excludes certain items, increased from 29.1% to 30.0%.
The difference was significant because the reported result included a $3.1 billion charge related to the remeasurement of a contingent consideration liability associated with fairlife. This affected the reported margin without necessarily reflecting an equivalent deterioration in the underlying business. Currency movements, input costs and operating expenses also influenced profitability.
The following year showed the opposite effect. In 2025, Coca-Cola’s reported operating margin rose to 28.7% from 21.2%. The 2024 result included the $3.1 billion fairlife charge, which affects the comparison. Comparable operating margin increased from 30.0% to 31.2%.
Reported margins can move sharply from one year to the next because of unusual charges, even when the underlying business changes much less. A decline in reported operating margin does not necessarily mean that a company has lost its pricing power.
These differences show why investors need to distinguish between reported results, company-adjusted measures and standardised financial data when assessing whether pricing power is translating into stronger profitability.
Coca-Cola Revenue and Operating Margin, 2019-2025
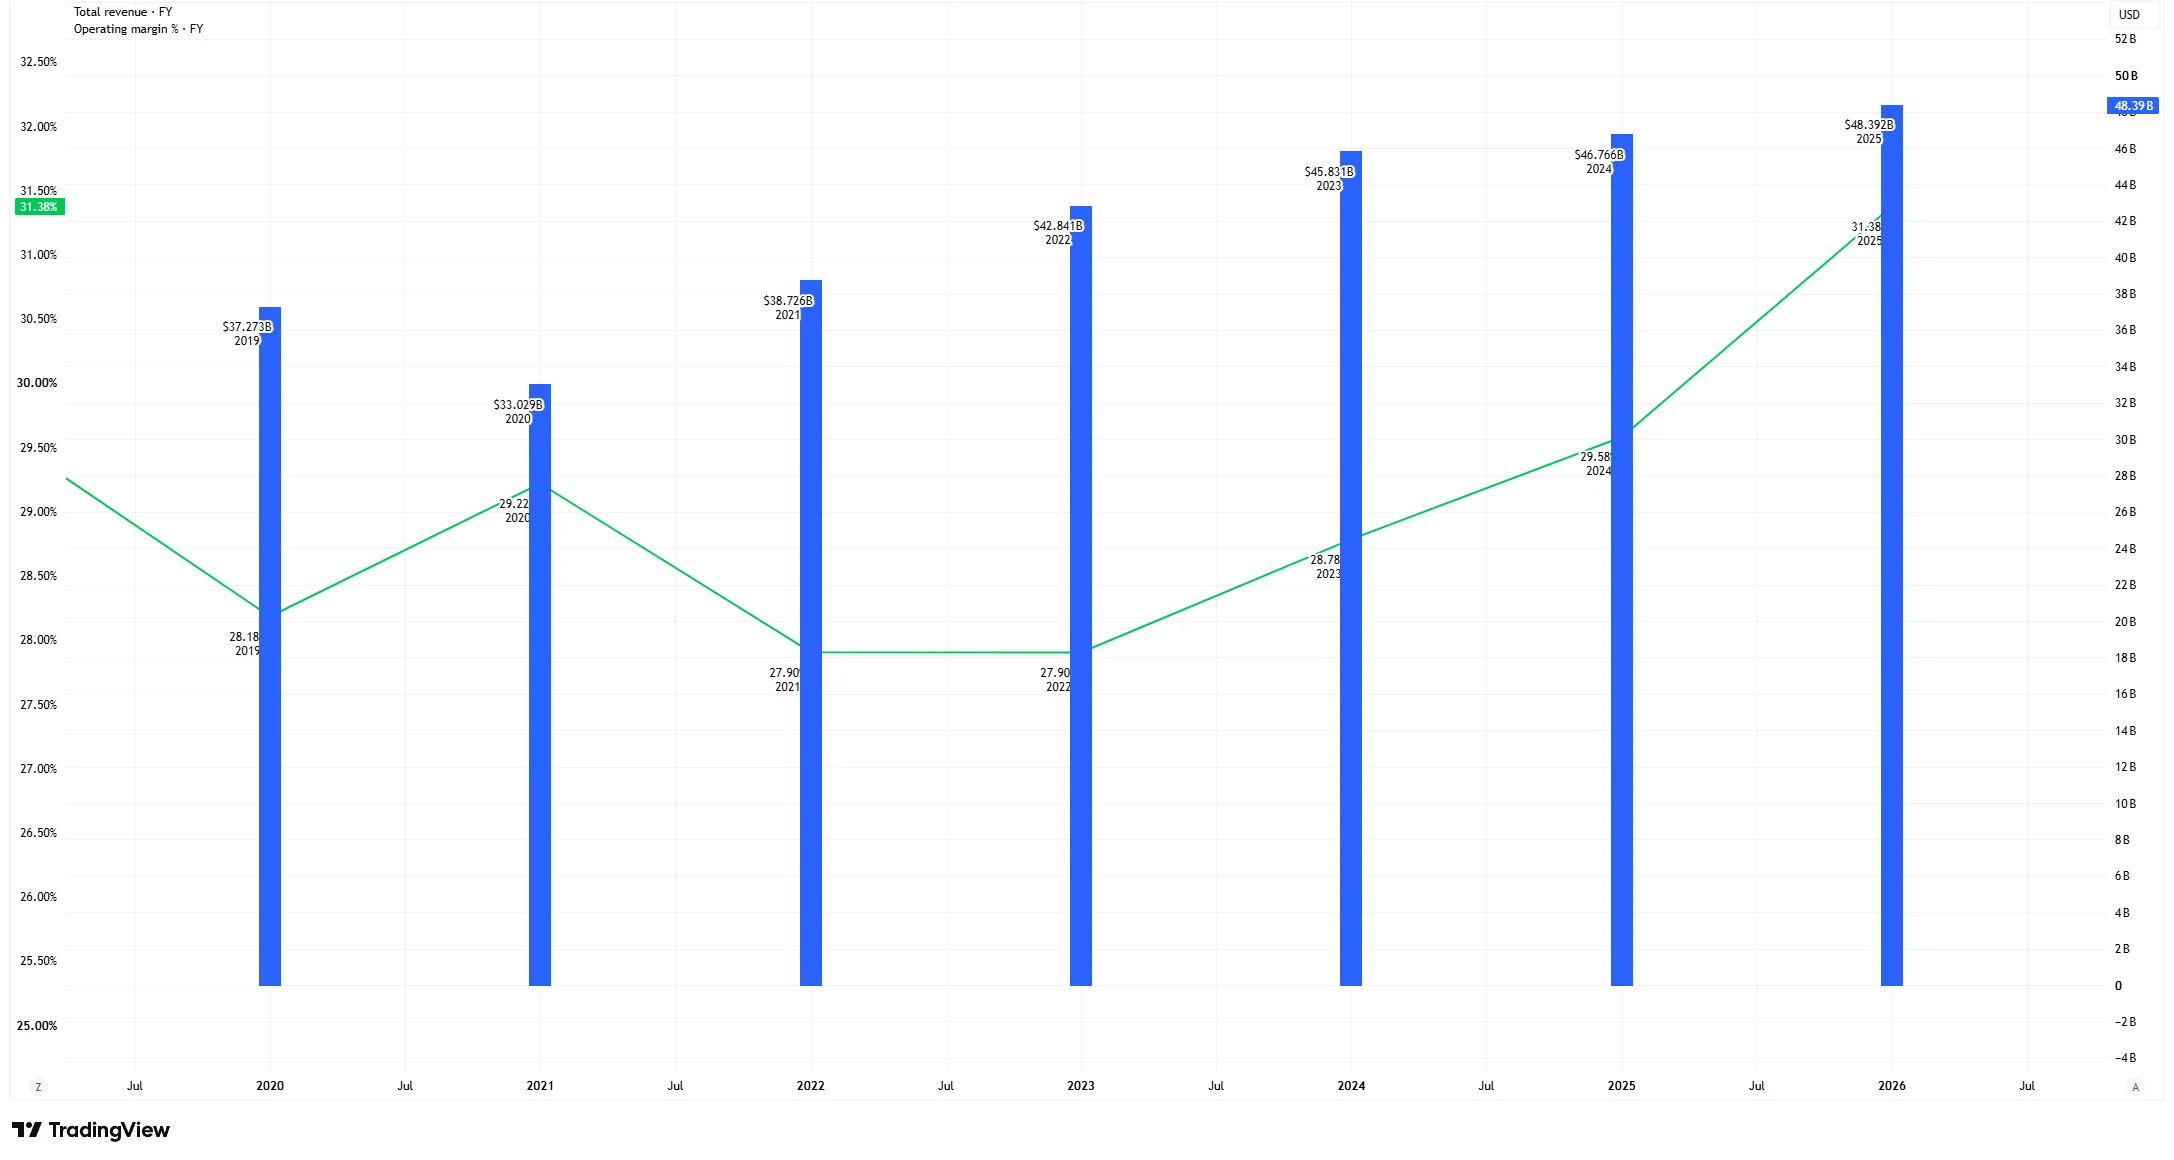
Source & Methodology: TradingView. The chart compares Coca-Cola’s annual total revenue and standardised operating margin for the financial years 2019 to 2025. Total revenue is shown in US dollars in billions as blue columns on the right axis. Standardised operating margin is shown as a percentage using the green line on the left axis. Annual figures are labelled by Coca-Cola’s financial year. Column positions on the time axis may not align exactly with the year labels. TradingView’s standardised financial data may differ from figures reported directly in Coca-Cola’s filings because of provider methodology and classification. Historical figures may also be revised. Data as of 13 October 2026.
Coca-Cola’s standardised revenue fell during the pandemic year of 2020, then rose in each following year to approximately $48.4 billion in 2025. Its standardised operating margin dipped to 27.9% in 2021 and 2022 before recovering to 31.4% in 2025, showing that revenue growth was eventually accompanied by an improvement in operating margin on TradingView’s standardised measure.
Bottom Line
Pricing power can indicate that a company has a strong brand, differentiated products or limited competition. It may help protect revenue and profitability when business costs rise.
However, price increases should be considered alongside sales volumes, market share, profit margins and management commentary. Higher prices are most encouraging when demand remains resilient, and the company retains a meaningful share of the additional revenue as profit.
Pricing power is therefore useful evidence about business quality, but it should not be assessed in isolation.