Indices Trading Conditions
| Symbol | Minimum Spread | Average Spread | Pip Value | Min price movement | Contract Size |
|---|
 100GBP
 |
5.5 | 5.8 | 13.32 | 0.1 | 10 |
 200AUD
 |
6.2 | 6.26 | 6.95 | 0.1 | 10 |
 225JPY
 |
4.2 | 5.12 | 0.62 | 0.1 | 100 |
 A50USD
 |
11 | 11 | 10.00 | 0.1 | 10 |
 D40EUR
 |
5.7 | 5.72 | 11.23 | 0.1 | 10 |
 E50EUR
 |
5.4 | 5.55 | 11.23 | 0.1 | 10 |
 F40EUR
 |
6.8 | 6.85 | 11.23 | 0.1 | 10 |
 H50HKD
 |
9 | 9.5 | 1.27 | 0.1 | 10 |
 NDXUSD
 |
3.7 | 3.85 | 10.00 | 0.1 | 10 |
 S35EUR
 |
7.2 | 10.51 | 11.23 | 0.1 | 10 |
 SPXUSD
 |
2.7 | 2.88 | 10.00 | 0.1 | 10 |
 U30USD
 |
3.2 | 3.65 | 10.00 | 0.1 | 10 |
 USDIDX
 |
20 | 22 | 10.00 | 0.001 | 1000 |
| Symbol | Minimum Spread | Average Spread | Pip Value | Min price movement | Contract Size |
|---|
|
100GBP |
4.5 | 4.8 | 13.32 | 0.1 | 10 |
|
200AUD |
5.2 | 5.25 | 6.95 | 0.1 | 10 |
|
225JPY |
3 | 3.59 | 0.62 | 0.1 | 100 |
|
A50USD |
10 | 10 | 10.00 | 0.1 | 10 |
|
D40EUR |
4.7 | 4.73 | 11.23 | 0.1 | 10 |
|
E50EUR |
4.2 | 4.25 | 11.23 | 0.1 | 10 |
|
F40EUR |
5.8 | 5.83 | 11.23 | 0.1 | 10 |
|
H50HKD |
8 | 8.5 | 1.27 | 0.1 | 10 |
|
NDXUSD |
2.5 | 2.6 | 10.00 | 0.1 | 10 |
|
S35EUR |
6 | 7.82 | 11.23 | 0.1 | 10 |
|
SPXUSD |
1.5 | 1.75 | 10.00 | 0.1 | 10 |
|
U30USD |
2 | 2.3 | 10.00 | 0.1 | 10 |
|
USDIDX |
5 | 6 | 10.00 | 0.001 | 1000 |
| Symbol | Minimum Spread | Average Spread | Pip Value | Min price movement | Contract Size |
|---|
|
100GBP |
4.5 | 4.8 | 13.32 | 0.1 | 10 |
|
200AUD |
5.2 | 5.25 | 6.95 | 0.1 | 10 |
|
225JPY |
3 | 3.25 | 0.62 | 0.1 | 100 |
|
A50USD |
10 | 10 | 10.00 | 0.1 | 10 |
|
D40EUR |
4.7 | 4.73 | 11.23 | 0.1 | 10 |
|
E50EUR |
4.2 | 4.23 | 11.23 | 0.1 | 10 |
|
F40EUR |
5.8 | 5.83 | 11.23 | 0.1 | 10 |
|
H50HKD |
8 | 8.5 | 1.27 | 0.1 | 10 |
|
NDXUSD |
2.5 | 2.55 | 10.00 | 0.1 | 10 |
|
S35EUR |
6 | 7.59 | 11.23 | 0.1 | 10 |
|
SPXUSD |
1.5 | 1.62 | 10.00 | 0.1 | 10 |
|
U30USD |
2 | 2.15 | 10.00 | 0.1 | 10 |
|
USDIDX |
5 | 5.5 | 10.00 | 0.001 | 1000 |
Jump into the Market
by Trading Indices
A stock market index is a measurement of the performance of a collection of many stocks, and is generally based around a single sector or country. For example, the S&P 500 tracks some of the largest companies in the US and is seen as an indicator for general US economic health. The Nasdaq-100, on the other hand, tracks one hundred of the largest non-financial companies listed on the Nasdaq stock exchange, and is often used as an indicator of the US tech industry.
As these indices pool the overall performance of many companies,
the risks associated with any single company are avoided, with prices
instead moving based on the macro-level trends.
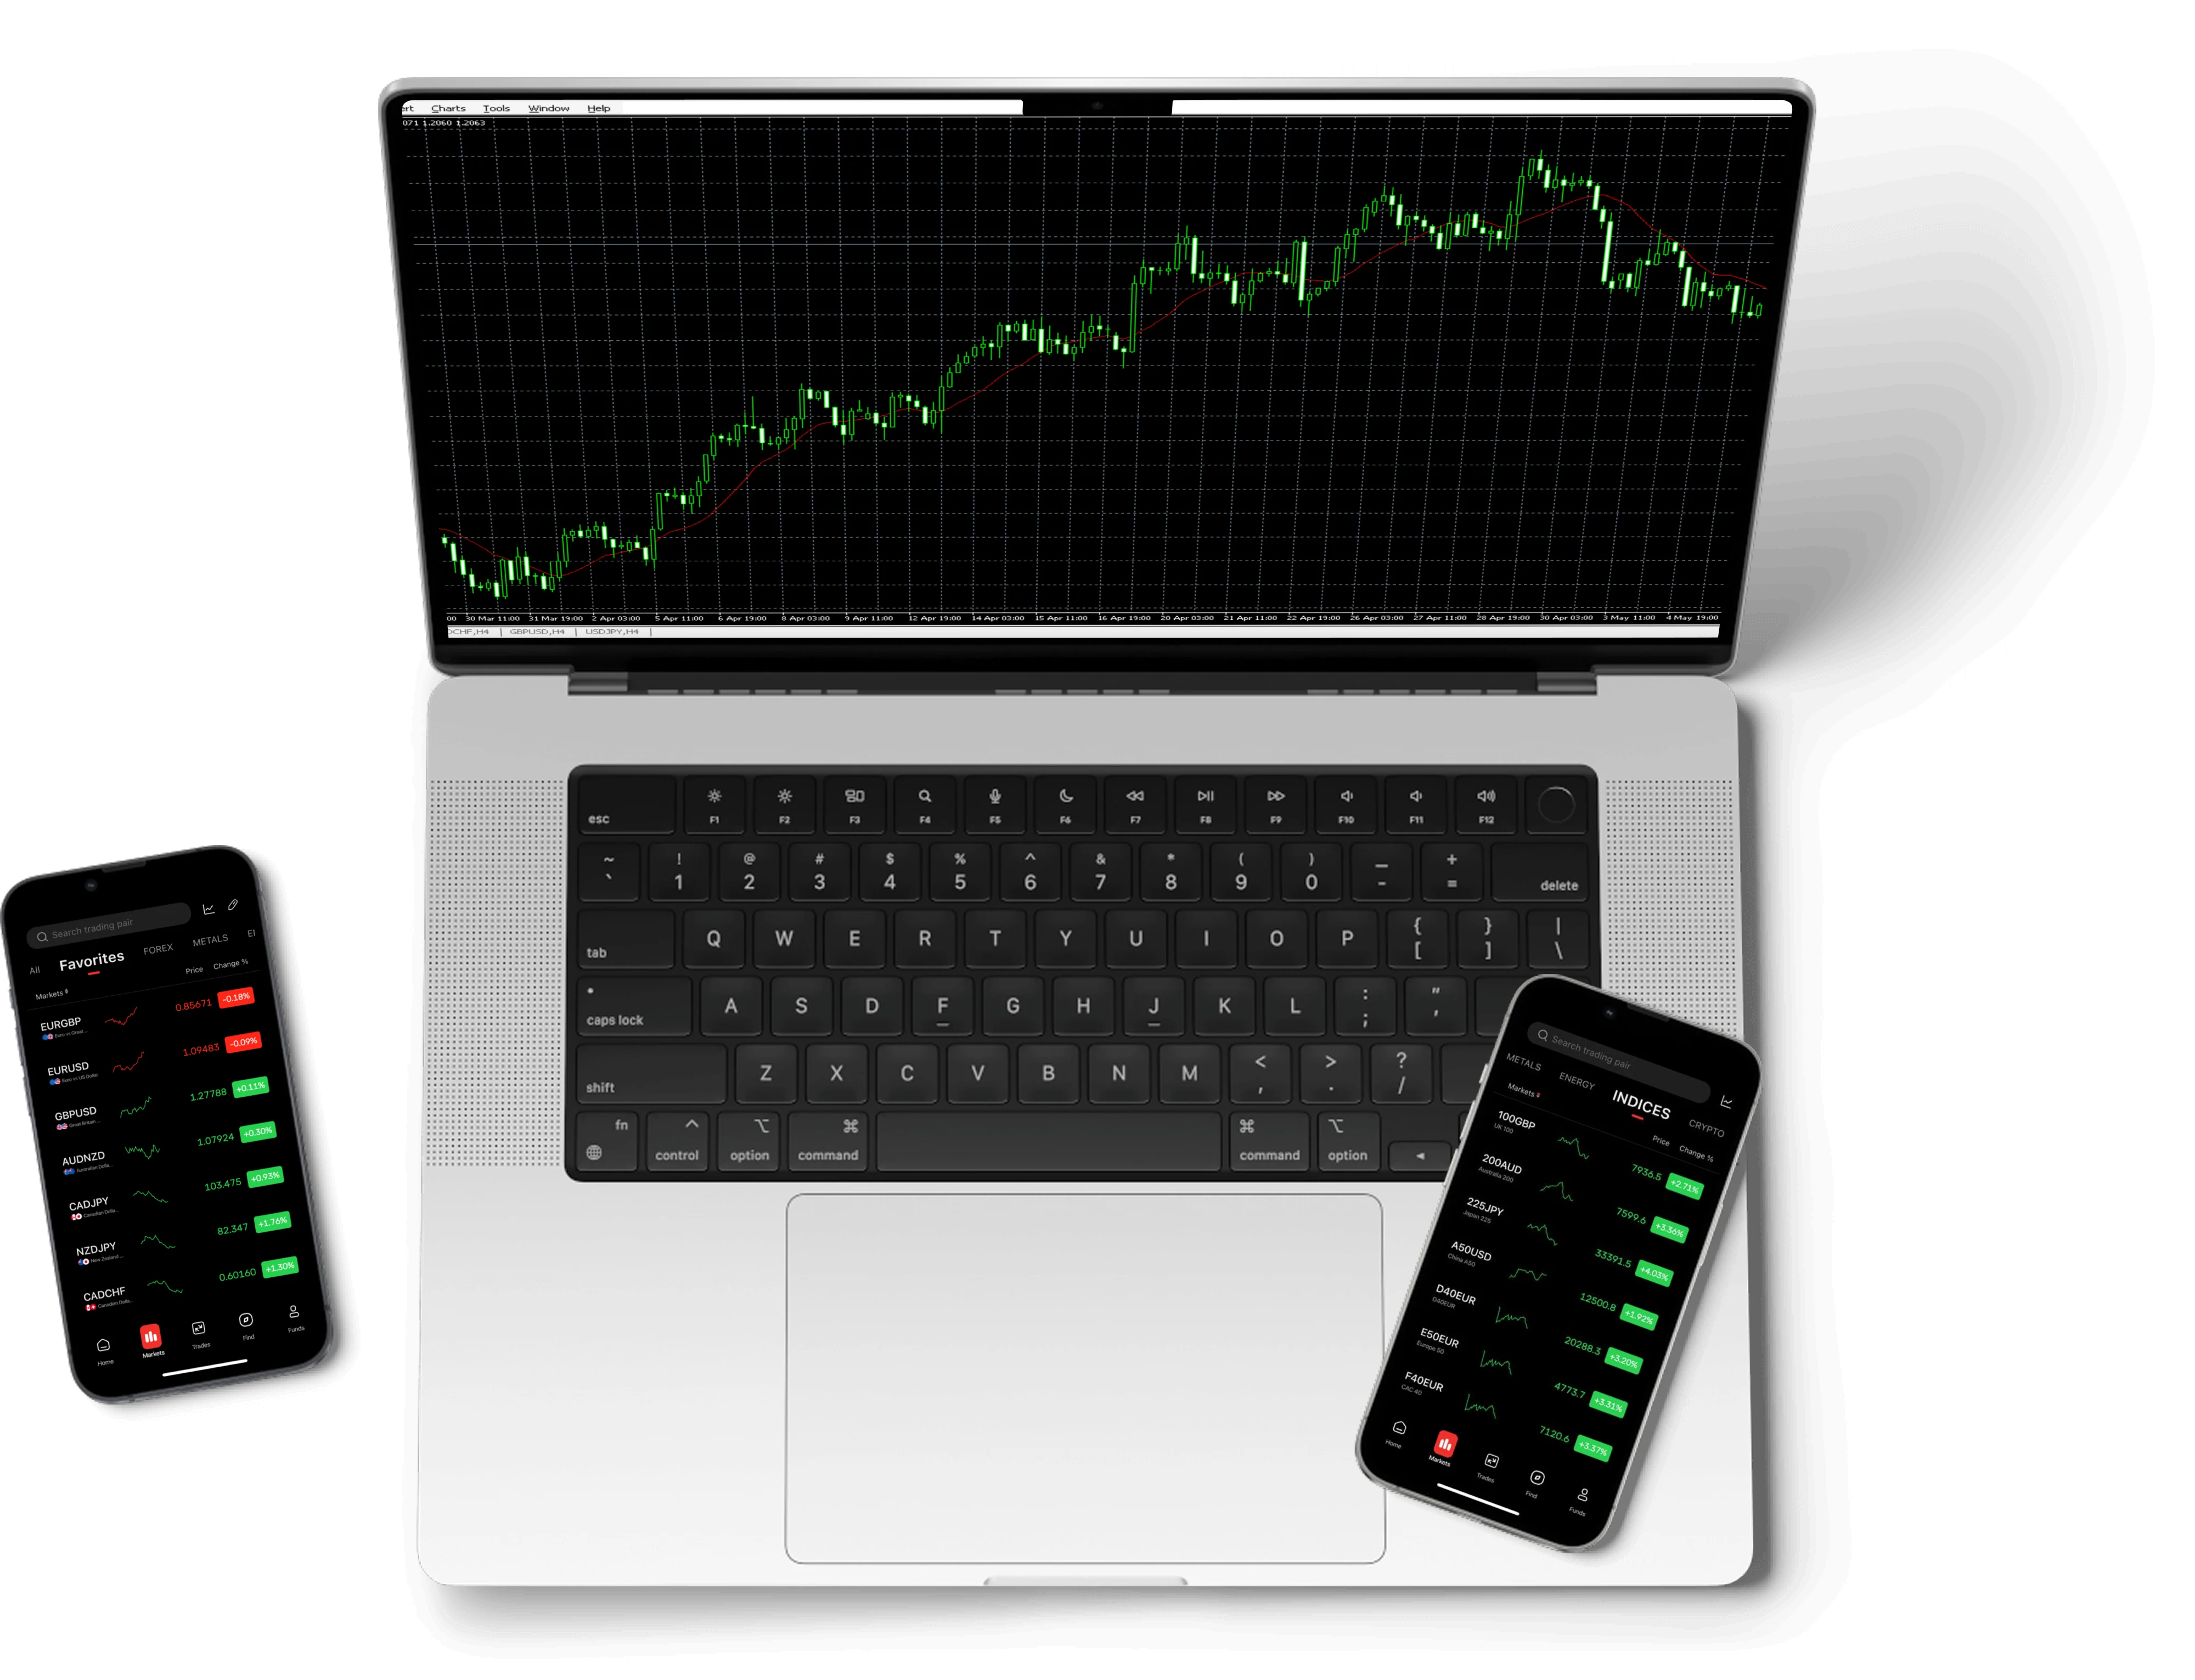
Index CFDs, which are offered by EC Markets, enable traders to speculate on price movements in various indices without needing to own all of the stocks in an index. Additionally, CFDs use leverage, which boosts both profits and losses, empowering a more versatile trading strategy suited to each trader. Explore market opportunities today with EC Markets’ indices CFDs!
Why Trade Indices With EC Markets

Trade the Whole
Market
Indices represent the movement
of entire markets, lowering risks
associated with individual stocks.

Target Various Sectors
and Countries
Indices are generally focused on
specific industries and
countries, giving traders the
ability to accurately target
promising markets.

Make Educated
Trading Decisions
Indices experience high liquidity,
which creates tight spreads and
makes entering and exiting the
market easy and quick.

Enhanced Liquidity
Facilitates Swift Trades
High trading volumes ensure
narrow spreads, permitting
efficient executions and
significantly reducing slippage
for participants.