













Williams %R Indicator Explained: How It Measures Price Momentum


The Williams %R indicator shows where the current closing price sits within its recent trading range. Learn how Williams %R is calculated, interpreted and used to assess price momentum.
Knowing whether price has risen or fallen is different from knowing where its closing price sits within its recent trading range. A market may finish near its recent highs, near its recent lows or somewhere between them.
Williams Percent Range, commonly known as Williams %R, measures this relationship. It compares the current closing price with the highest high and lowest low over a selected number of periods.
The indicator provides context about historical price behaviour. It does not predict the next market move.
What Is the Williams %R Indicator?
Developed by Larry Williams, Williams %R is a momentum oscillator: an indicator that moves within a defined range to help describe price behaviour. It normally appears as a single line in a separate panel below price.
Its scale runs from −100 to 0. Readings near 0 mean the closing price is near the highest high of the selected period. Readings near −100 mean it is near the lowest low. The negative scale does not represent a percentage loss.
How Is Williams %R Calculated?
The formula is:
Williams %R = [(Highest high – Current closing price) ÷ (Highest high − Lowest low)] × −100
The highest high and lowest low come from the selected lookback period. The calculation expresses the distance between the close and the highest high relative to the full range.
Suppose the highest high over 14 periods is 110, the lowest low is 100 and the current closing price is 108:
Williams %R = [(110 − 108) ÷ (110 − 100)] × −100 = −20
This places the close near the upper end of the range. It does not mean price has fallen by 20%.
How to Read the Williams %R Indicator
Williams %R readings can be interpreted by looking at where the indicator sits between 0 and −100, with −20 and −80 commonly used as reference levels.
Near the Upper End: −20 to 0
This area is commonly described as overbought. The closing price is near the upper end of its recent range.
Such readings can accompany strong upward movement. Overbought does not mean the instrument is necessarily overvalued or that price must fall.
Near the Lower End: −100 to −80
This area is commonly described as oversold. The closing price is near the lower end of its recent range.
Such readings can accompany strong downward movement. Oversold does not mean the instrument is necessarily undervalued or that price must rise. An indicator can remain near either extreme for an extended period.
Between −80 and −20
Readings in this area place the close away from the extreme ends of the selected range. They do not establish that the market is sideways or neutral.
The −20 and −80 levels are reference points rather than guaranteed reversal boundaries.
Rising and Falling Williams %R
A rising line moves towards 0, meaning the closing price is closer to the upper end of the current lookback range. A falling line moves towards −100, indicating proximity to the lower end.
The range itself can also change. As the lookback window advances, an older high or low may leave the calculation, while a new extreme may enter it.
Consequently, a rising indicator does not always mean the latest candle rose, and a falling indicator does not always mean it fell. Both the closing price and the changing range boundaries influence the reading.
During a persistent trend, readings may remain near an extreme. Crossing −20 or −80 does not create an automatic entry or exit signal.
Williams %R in Practice
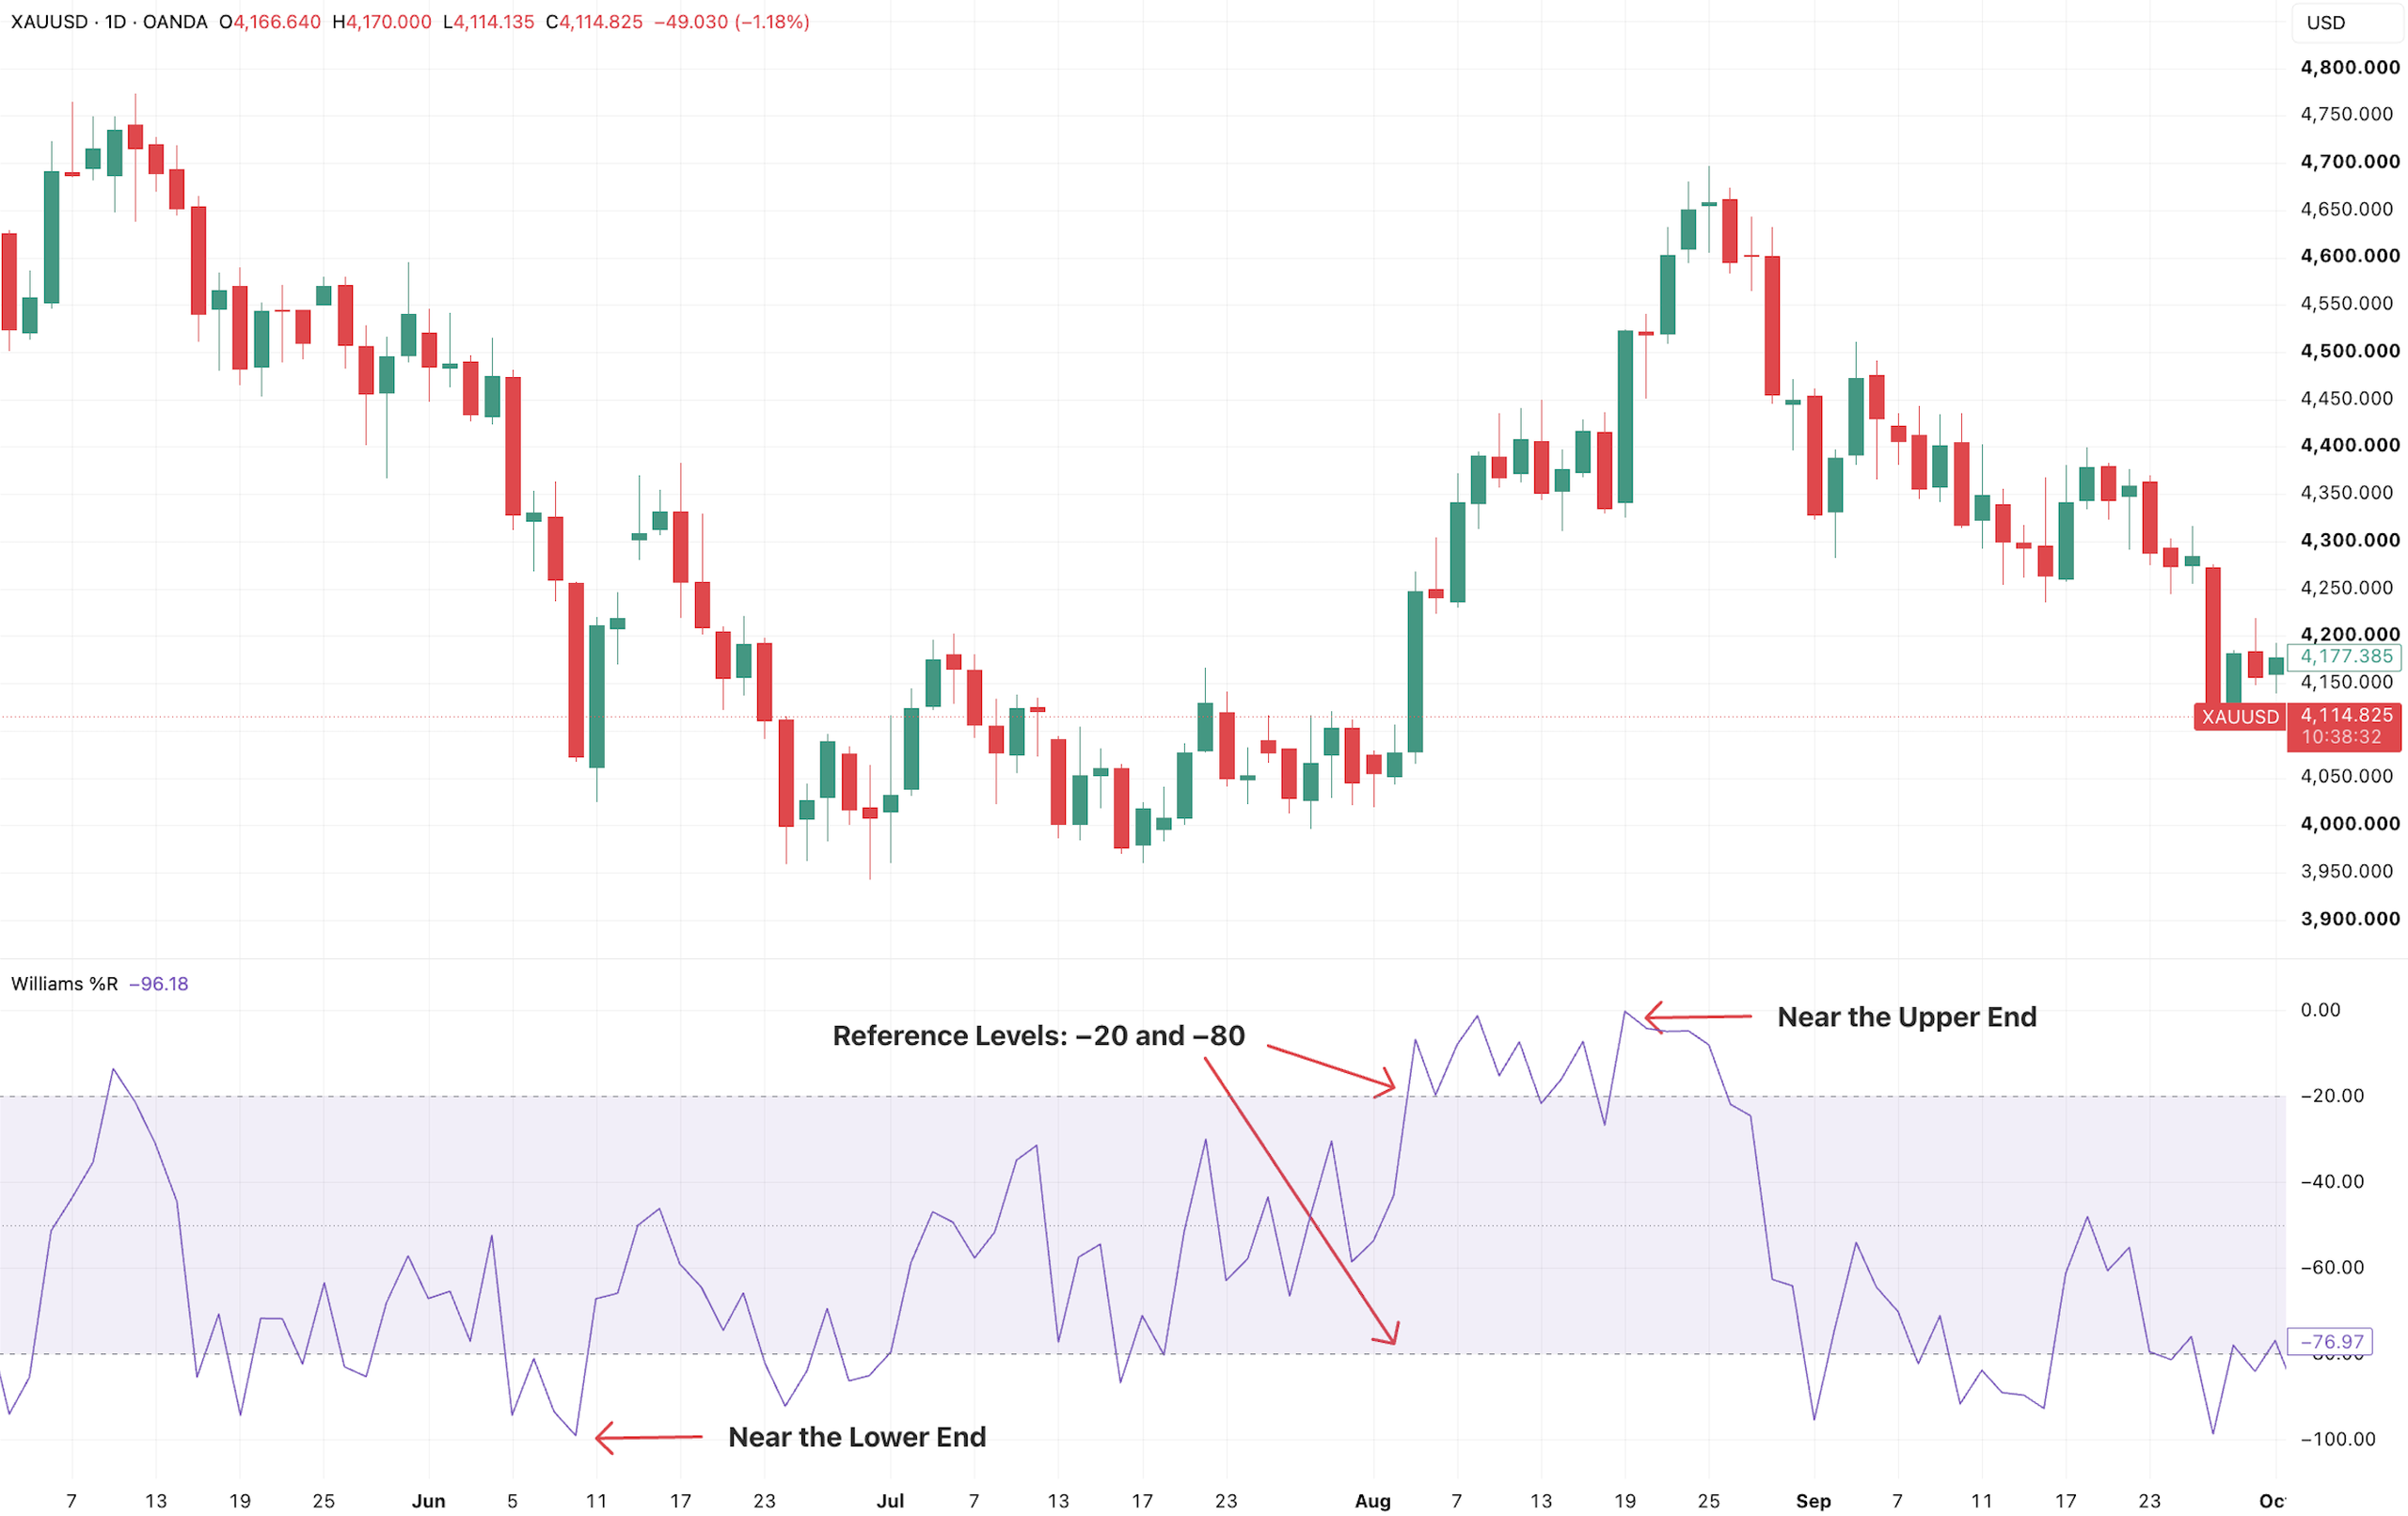
The following example shows how a 14-period Williams %R changes alongside daily price movements in gold.
XAU/USD daily chart with Williams %R (14), May to October 2026
Source: TradingView. Past performance is not a reliable indicator of future performance. Data accurate as of 7 October 2026.
Williams %R shows where the current closing price sits within the recent 14-period high-to-low range. The −20 and −80 levels are commonly watched reference points rather than guaranteed reversal levels.
The indicator shows where the closing price sits within its recent 14 candle range. The −20 and −80 lines mark commonly watched reference levels.
During June, the Williams %R line frequently moves below −80. The “Near the Lower End” annotation highlights a trough in early June, when gold’s closing price was close to the lowest low of its selected range.
During July, readings move through different parts of the scale as the closing price and range boundaries change.
In August, the indicator spends several periods above −20. The “Near the Upper End” annotation highlights readings close to 0 around the second half of the month. These show that the closing price was near the highest high of the selected range.
Williams %R subsequently falls below −80 during parts of September. This sequence illustrates changing positions within the recent range, rather than proof that the indicator predicted a reversal.
What Are the Limitations of Williams %R?
Williams %R cannot anticipate unexpected announcements or other events. Its readings describe available price data, which may change quickly when new information reaches the market.
Frequent movements across reference levels can produce misleading signals when those crossings are interpreted in isolation.
Shorter lookback periods generally respond more quickly but may produce more fluctuations. Longer periods provide a broader comparison but may respond more slowly. Different settings and timeframes can therefore change the readings.
Traders may consider Williams %R alongside price action, support and resistance and wider market structure. Combining these tools does not eliminate false signals or unexpected movements.
Bottom Line
Williams %R shows where the current closing price sits within its recent high-to-low range. Readings near 0 indicate that the close is nearer the upper end of that range, while readings near −100 indicate that it is nearer the lower end.
The indicator can provide useful context about historical price momentum, but overbought and oversold readings do not guarantee that a market will reverse. Williams %R is therefore best interpreted alongside price action, support and resistance and broader market structure rather than as a standalone trading signal.