














Rate of Change (ROC) Explained: How the Indicator Measures Momentum


The Rate of Change indicator measures how much price has changed over a selected period. Here’s how ROC is calculated, interpreted and used to assess historical momentum.
The direction of a price move and the pace of that move provide different information. Price may remain above an earlier level even as its percentage gain becomes smaller. Similarly, a percentage decline may become less pronounced while price remains below its earlier level.
The Rate of Change indicator, commonly known as ROC, measures the percentage change between the current closing price and the closing price a selected number of periods earlier. It provides context about historical momentum but does not predict the next price movement.
What Is the Rate of Change (ROC) Indicator?
ROC is a momentum indicator that fluctuates above and below zero. It is not restricted to a scale such as 0 to 100.
The indicator can appear in a separate panel below price or share the main chart using its own scale. In this article’s chart, the blue ROC line uses the percentage scale on the left, while gold prices use the scale on the right.
The selected setting is 14 periods. On a daily chart, this compares the current closing price with the closing price 14 daily candles earlier, rather than 14 calendar days. Fourteen periods is the setting chosen for this example, rather than a universal standard.
How Is ROC Calculated?
ROC = [(Current Closing Price − Closing Price n Periods Ago) ÷ Closing Price n Periods Ago] × 100
The letter “n” represents the selected lookback period.
If the current closing price is 110 and the closing price 14 periods earlier was 100, ROC is +10%. If the current closing price is 90 and the earlier closing price was 100, ROC is −10%.
These readings describe the percentage change across the selected period. They are not forecasts or expected returns.
How to Read the Rate of Change Indicator
ROC readings can be interpreted by looking at whether the indicator is above, below or crossing the zero line.
Positive ROC
A reading above zero means the current closing price is higher than the closing price the selected number of periods earlier.
For example, +5% means price is 5% above that earlier closing price. It does not mean every candle within the period has risen or that price will continue rising.
Negative ROC
A reading below zero means the current closing price is lower than the earlier closing price.
A reading of −5% means price is 5% below that earlier closing price. It does not mean every candle within the period has fallen or that further declines are guaranteed.
The Zero Line
ROC equals zero when the current closing price equals the closing price the selected number of periods earlier.
A crossing above or below zero shows a change in this comparison. It does not create an automatic buy or sell signal.
Rising and Falling ROC
The level of ROC and the direction of its movement should be considered separately.
When ROC is positive and rising, the percentage gain relative to the earlier closing price is increasing. When it is positive but falling, that percentage gain is decreasing, although price remains above its earlier level.
When ROC is negative and falling further below zero, the percentage decline is increasing. When it is negative but rising towards zero, the percentage decline is becoming smaller. This does not by itself confirm a price reversal.
ROC changes as the current closing price changes and as a different historical closing price enters the comparison. Consequently, rising ROC does not always mean the latest candle rose, and falling ROC does not always mean it fell.
Rate of Change in Practice
The following example shows how the 14-period ROC changes alongside daily price movements in gold.
XAU/USD daily chart with Rate of Change (14), May to September 2026
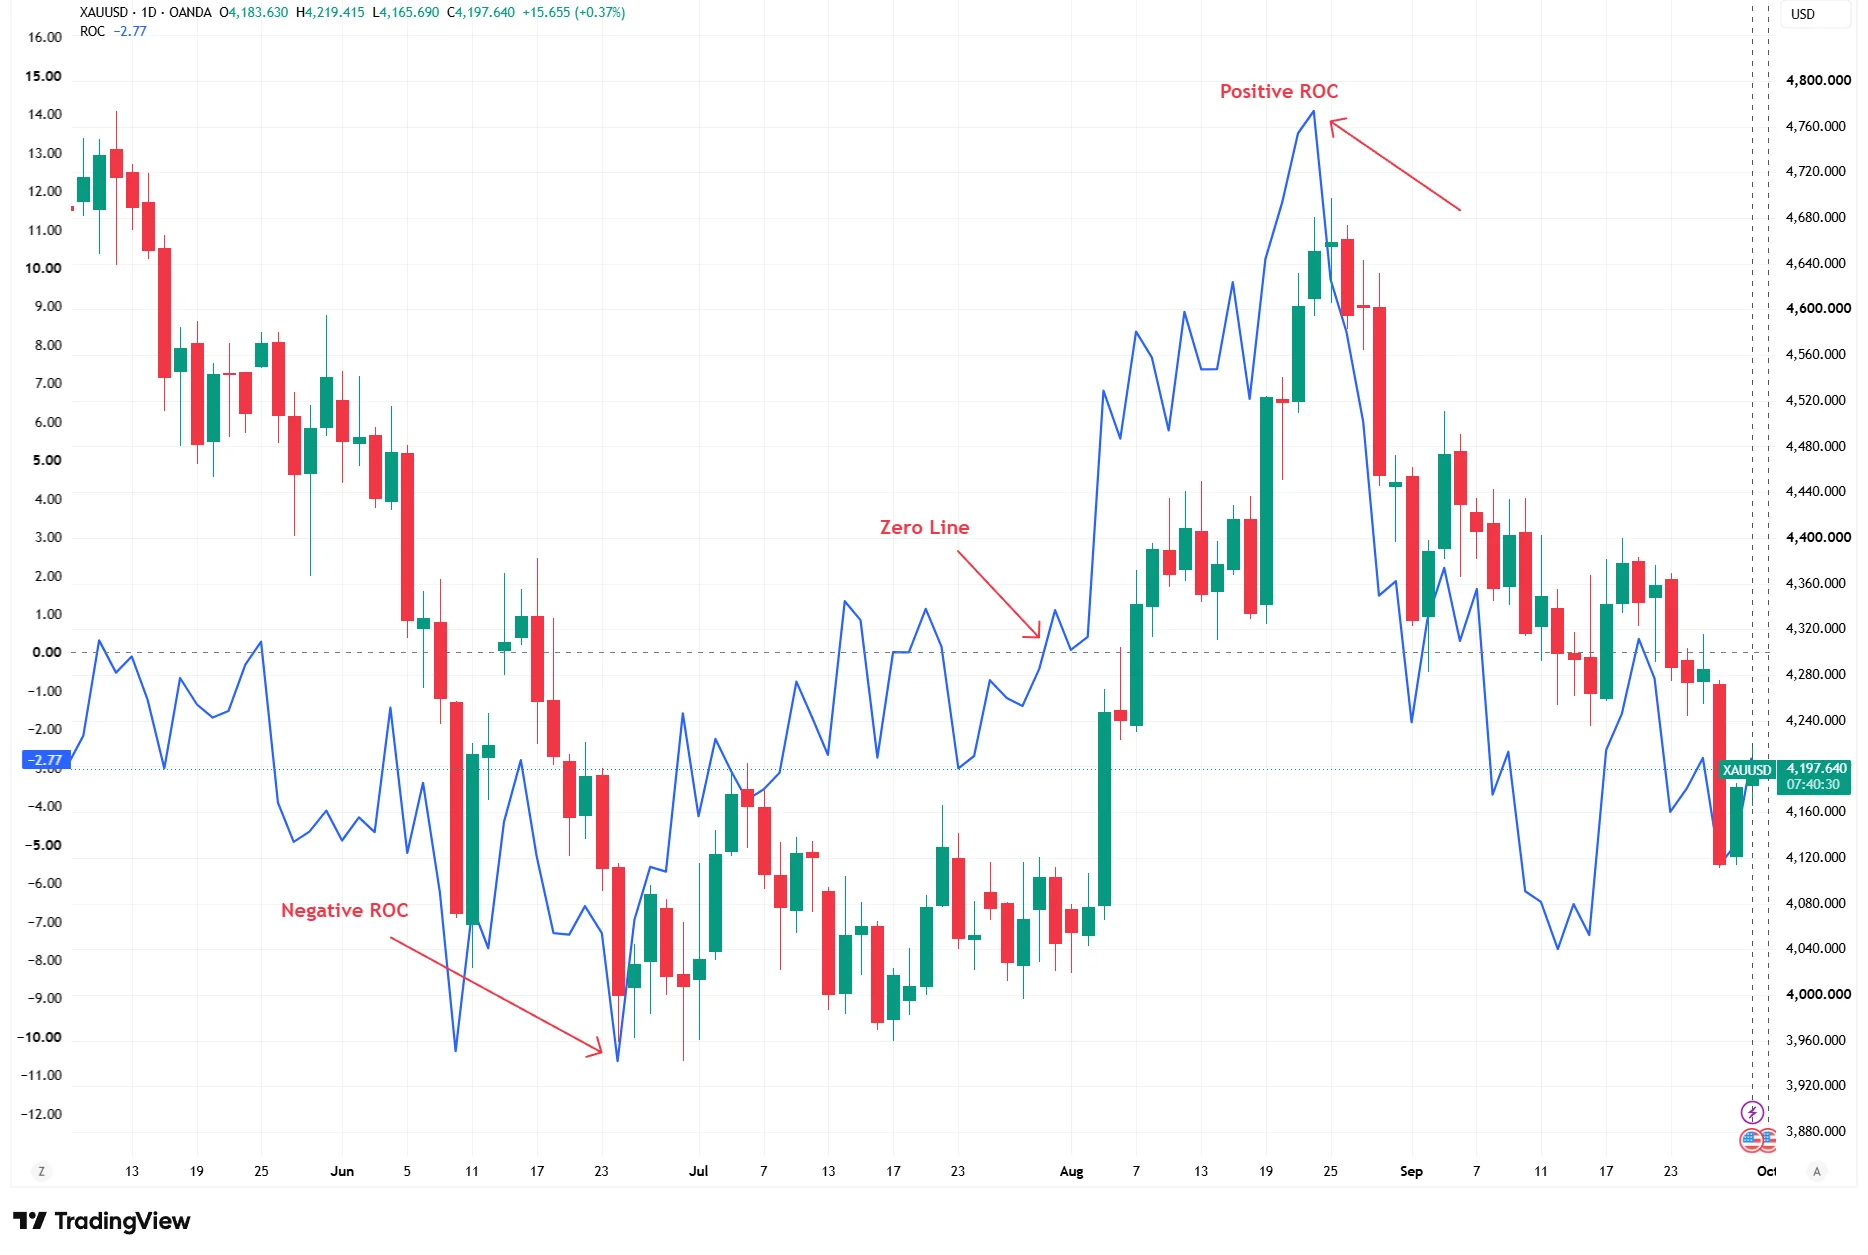
Source: TradingView. Past performance is not a reliable indicator of future performance. Data accurate as of 30 September 2026.
The 14-period ROC shows the percentage change between the current closing price and the closing price 14 daily candles earlier, with positive readings above zero and negative readings below zero.
The chart shows negative ROC readings during much of June. These indicate that gold’s closing price was below its closing price 14 daily candles earlier. The Negative ROC annotation identifies one of these readings.
During July, ROC moves above and below zero as the relationship between the current and earlier closing prices changes.
In August, the blue line rises clearly above zero. The Positive ROC annotation highlights a period when gold’s closing price was substantially higher than its closing price 14 daily candles earlier. ROC subsequently falls and returns to negative territory during parts of September.
The dashed Zero Line provides the reference separating positive and negative readings. These movements describe historical percentage changes rather than predicting continuation or reversal.
What Are the Limitations of the Rate of Change Indicator?
ROC uses historical prices and cannot predict unexpected events. Zero line crossings may occur frequently during sideways conditions.
A high positive reading does not automatically mean price must fall. A deeply negative reading does not automatically mean price must rise. There are no universal overbought or oversold thresholds suitable for every instrument and timeframe.
Shorter lookback periods generally respond more quickly but produce more fluctuations. Longer periods provide a broader comparison but may respond more slowly.
ROC should be considered alongside price action, support and resistance and wider market structure.
Bottom Line
The Rate of Change indicator measures the percentage change in price over a selected period. Positive and negative readings show whether the current closing price is above or below its earlier level, while changes in ROC provide additional context about the pace of that movement.
ROC can help traders assess historical momentum, but it does not predict whether a price movement will continue or reverse. The indicator is therefore best considered alongside price action, support and resistance and broader market structure.