













Multi-Timeframe Analysis Explained: How to Analyse Multiple Timeframes


Table of Contents
- What Is Multi-Timeframe Analysis?
- Why Do Traders Use Multiple Timeframes?
- What Is Market Noise?
- Common Trading Timeframes
- What Is the Top-Down Approach?
- Multi-Timeframe Analysis Example
- What Happens When Timeframes Disagree?
- How Do Traders Choose Which Timeframes to Use?
- Does Using More Timeframes Improve Accuracy?
- Common Mistakes to Avoid
- Can Multi-Timeframe Analysis Predict the Market?
- Bottom Line
After learning how traders identify chart patterns, many investors ask another important question: which chart should they actually be analysing?
Financial markets can be viewed over many different time periods, from one-minute charts to monthly charts covering many years. Looking at only a single timeframe can sometimes provide an incomplete picture of market conditions. This is why some traders analyse the same market across multiple timeframes to place shorter-term price movements within a broader market context.
What Is Multi-Timeframe Analysis?
Multi timeframe analysis is the process of analysing the same financial instrument across two or more different chart timeframes before making a trading decision.
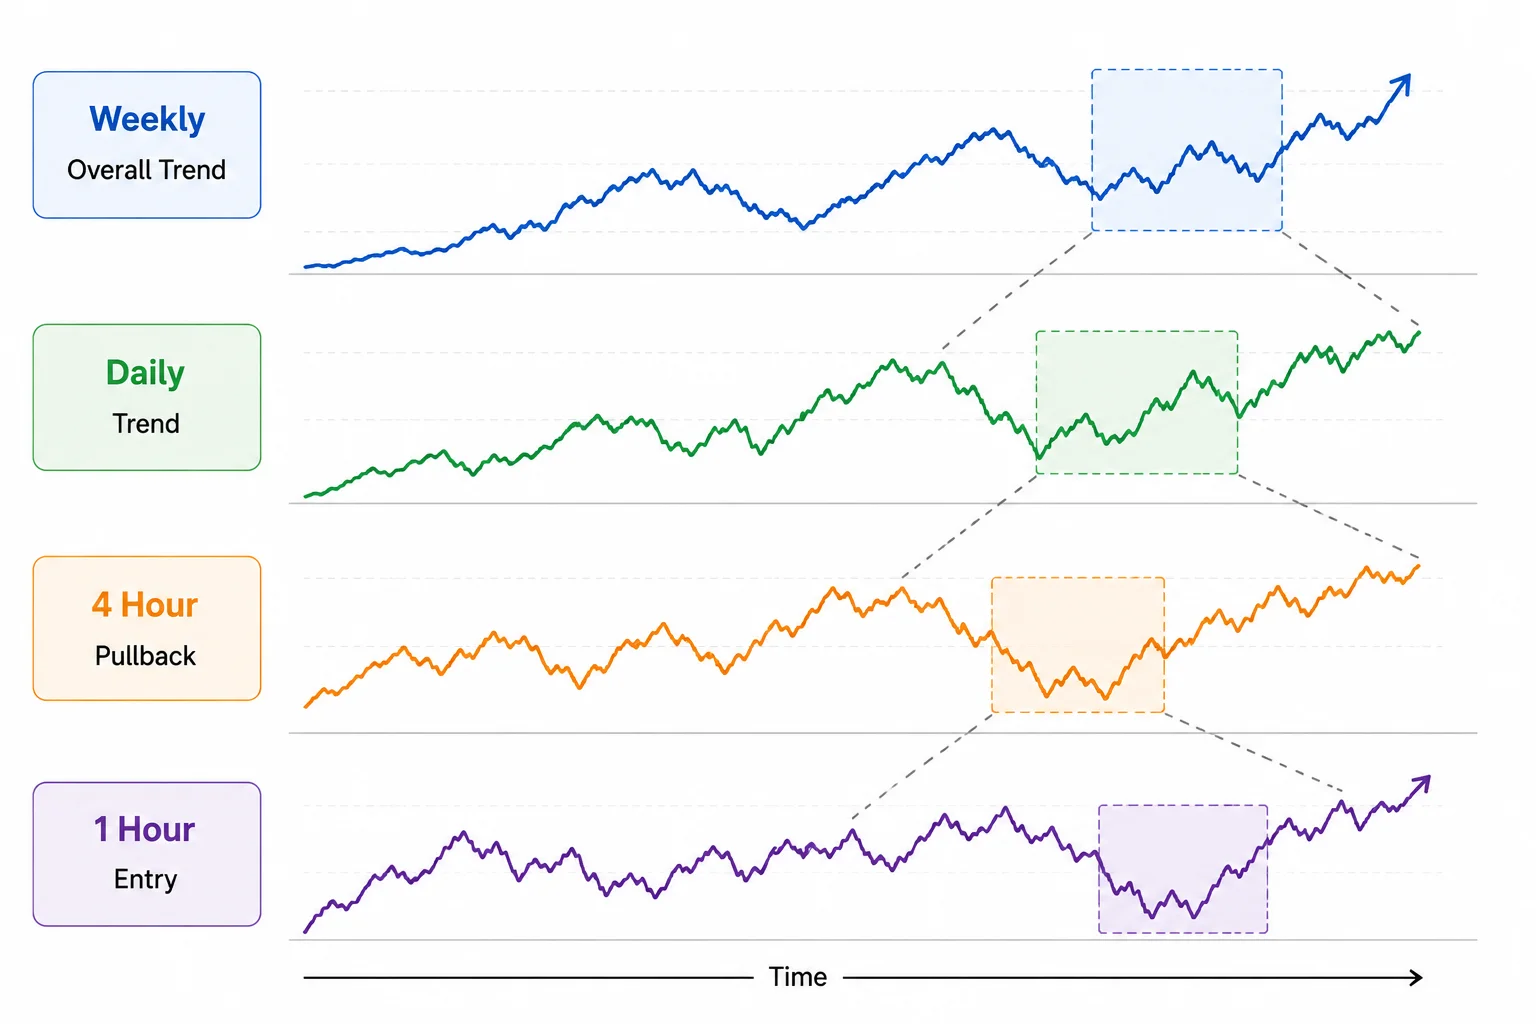
Rather than relying on a single chart, traders compare longer and shorter timeframes to build a more complete understanding of market direction. A longer timeframe may provide context about the broader trend, while a shorter timeframe can show more detailed price movement within that trend.
Although no approach guarantees successful trading, analysing multiple timeframes may help traders place short term price movements into a broader market context.
Why Do Traders Use Multiple Timeframes?
Financial markets rarely move in straight lines. Even during a strong long-term trend, prices often experience temporary pullbacks, periods of consolidation or increased volatility.
A trader focusing only on a short timeframe may mistake a temporary pullback for the beginning of a major reversal. Conversely, someone looking only at a long-term chart may overlook opportunities to improve the timing of an entry or exit.
By combining multiple timeframes, traders attempt to understand both the overall market direction and the shorter-term price movements occurring within that trend.
What Is Market Noise?
Market noise refers to short term price movements that do not necessarily reflect the broader direction of the market. These fluctuations may be caused by temporary buying and selling activity, news headlines or short-term changes in investor sentiment.
By analysing higher timeframes alongside lower ones, traders may find it easier to distinguish between temporary volatility and more meaningful market trends.
Common Trading Timeframes
Different traders use different chart timeframes depending on their objectives and trading style. The table below shows examples of how different chart timeframes may be used.
| Timeframe | Common Use | Commonly Used By |
| Monthly | Long term trend analysis | Long term investors |
| Weekly | Primary trend analysis | Position traders |
| Daily | Trade planning | Swing traders |
| 4 Hour | Trade setup | Swing traders |
| 1 Hour | Entry and exit timing | Active traders |
| 15 Minute | Short term entries | Day traders |
| 5 Minute | Trade execution | Scalpers |
What Is the Top-Down Approach?
One method of multi-timeframe analysis is the top-down approach.
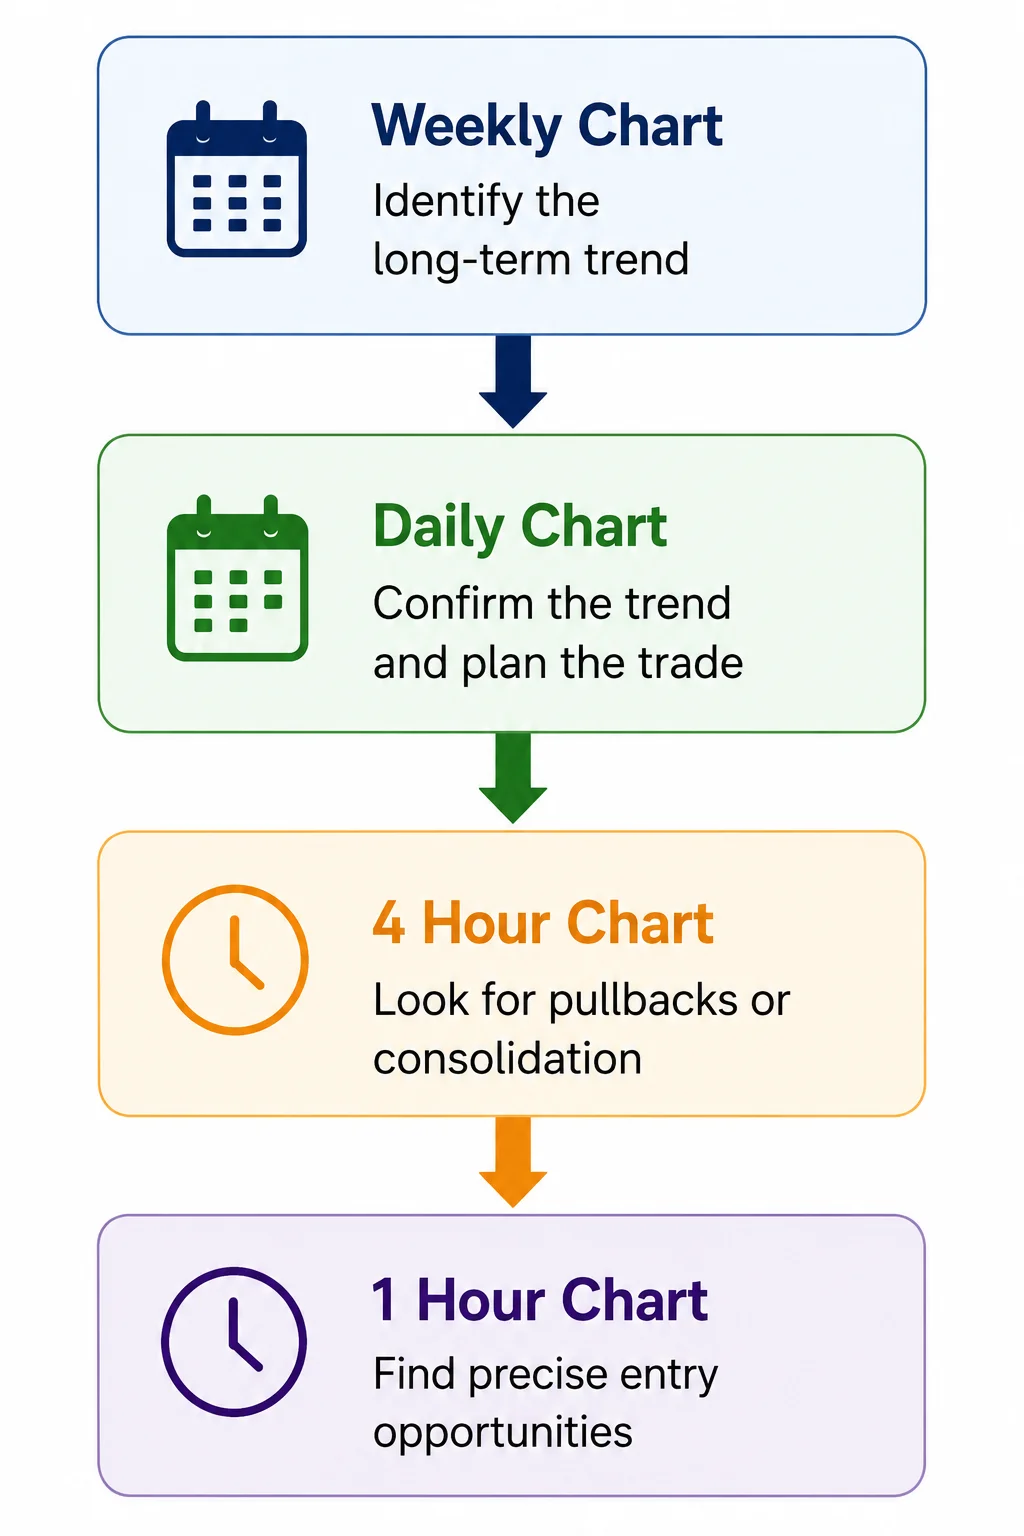
Rather than starting with the shortest chart, a top-down approach begins with longer timeframes before gradually moving to shorter ones.
A typical process may involve:
- Identifying the long-term trend on the weekly or daily chart.
- Looking for pullbacks or consolidation on the four-hour chart.
- Examining the one-hour or 15-minute chart for more detailed price action.
This approach allows shorter-term price action to be interpreted within the context of the broader trend.
Examples shown are for educational purposes only and should not be interpreted as investment recommendations.
Viewing the Same Market Across Multiple Timeframes
Examples shown are for educational purposes only and should not be interpreted as investment recommendations.
Multi-Timeframe Analysis Example
Imagine a trader is analysing a company’s shares.
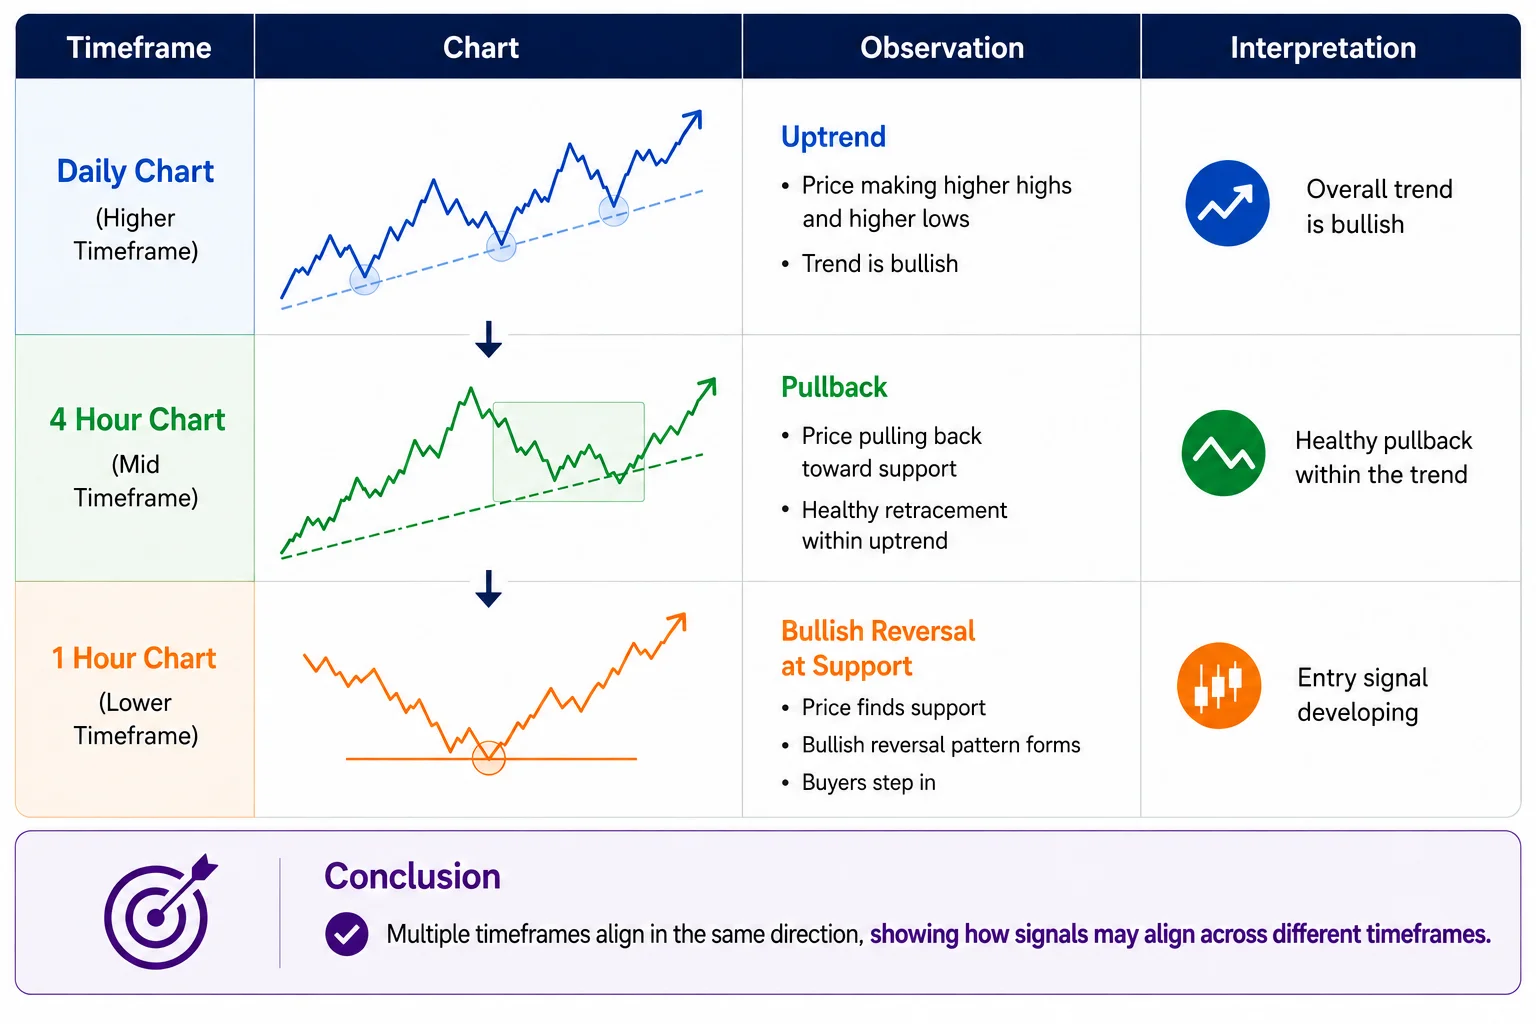
- The daily chart shows that the share price has been making higher highs and higher lows for several months, suggesting an established uptrend.
- The four-hour chart shows a temporary pullback within that uptrend.
- The one-hour chart then forms a bullish reversal pattern near a support level.
Viewed together, the three charts provide different levels of context: the daily chart shows the broader trend, the four-hour chart shows the pullback and the one-hour chart provides more detail about the shorter-term price movement. This alignment does not guarantee that the broader trend will continue.
What Happens When Timeframes Disagree?
Different timeframes do not always tell the same story.
For example, the weekly chart may indicate a strong uptrend while the one-hour chart shows a short-term decline.
This does not necessarily mean either chart is incorrect. Instead, each timeframe reflects market behaviour over a different period.
Short-term price movements can occur within longer-term trends, which is why different timeframes may appear to give conflicting information. Comparing how the different timeframes fit together can provide additional context before a trading decision is made.
Example of Multi Timeframe Alignment
Examples shown are for educational purposes only and should not be interpreted as investment recommendations.
How Do Traders Choose Which Timeframes to Use?
There is no single combination of timeframes that suits every trader or market.
The timeframes used may depend on the trader’s objectives, trading style and how frequently they monitor the market. A longer timeframe can provide broader market context, while a shorter timeframe shows more detailed price movement.
Beginners may find it easier to start with two or three complementary timeframes and develop a consistent analysis process. More experienced traders may adapt their timeframe selection depending on the market, strategy or trading horizon.
The important point is that each timeframe serves a clear purpose within the analysis rather than simply adding more charts.
Does Using More Timeframes Improve Accuracy?
Not necessarily.
Using additional timeframes does not guarantee better trading decisions. In fact, analysing too many charts can sometimes lead to conflicting signals and unnecessary complexity.
Using two or three complementary timeframes may provide sufficient context without introducing unnecessary complexity.
Common Mistakes to Avoid
New traders sometimes make several common mistakes when using multiple timeframes.
These include:
- Analysing too many timeframes at once and becoming overwhelmed
- Focusing only on very short-term charts while ignoring the broader trend
- Assuming that signals on one timeframe always override signals on another
- Changing trading decisions every time a shorter timeframe fluctuates
Using a structured approach and limiting analysis to a few complementary timeframes may help traders make more consistent decisions.
Can Multi-Timeframe Analysis Predict the Market?
No.
Analysing multiple timeframes does not enable traders to predict future price movements with certainty. Financial markets remain influenced by economic data, company news, geopolitical developments and changes in investor sentiment.
Instead, multi timeframe analysis provides additional context that may help traders make more informed decisions while recognising that uncertainty always remains.
Bottom Line
Multi-timeframe analysis involves viewing the same market across different chart timeframes to place shorter-term price movements within a broader context. Longer timeframes can provide information about the wider market structure, while shorter timeframes show more detailed price behaviour.
There is no single best combination of timeframes, and analysing more charts does not necessarily improve accuracy. Each timeframe provides different information, and conflicting signals can occur.
Multi-timeframe analysis does not predict future price movements or eliminate investment risk. It is most useful as a way of adding context to technical analysis rather than as a standalone trading strategy.
Continue learning: Explore our guides to Technical Indicators Explained and Chart Patterns Explained to see how indicators and price patterns can be considered alongside multi-timeframe analysis.