














Chart Patterns Explained: A Beginner's Guide to Technical Analysis


After learning how professional investors estimate the value of a company using fundamental analysis, many investors become interested in another popular approach to analysing financial markets: technical analysis. Chart patterns are one of the most widely recognised tools used by technical analysts to study price movements and market behaviour.
Rather than focusing on company financial statements or economic data, technical analysis studies historical price movements and trading activity to identify patterns that may provide insight into future market behaviour.
Understanding chart patterns can help investors appreciate how traders interpret market psychology, although no chart pattern can guarantee future price movements.
What Are Chart Patterns in Technical Analysis?
Chart patterns are recognisable formations that develop on price charts as buyers and sellers interact over time. Technical analysts study these patterns because they may provide clues about changes in market sentiment, potential trend reversals or the continuation of existing trends.
Chart patterns do not predict the future with certainty. Instead, they are used alongside other forms of analysis to help assess possible market outcomes.
Reversal and Continuation Patterns
Chart patterns are generally grouped into two broad categories:
- Reversal Patterns may suggest that an existing trend is losing momentum and could change direction.
- Continuation patterns may suggest that the current trend is temporarily pausing before continuing in the same direction.
Understanding the difference helps traders interpret what a specific pattern may be indicating rather than assuming every formation has the same structural meaning.
Common Reversal Patterns
1. Head and Shoulders
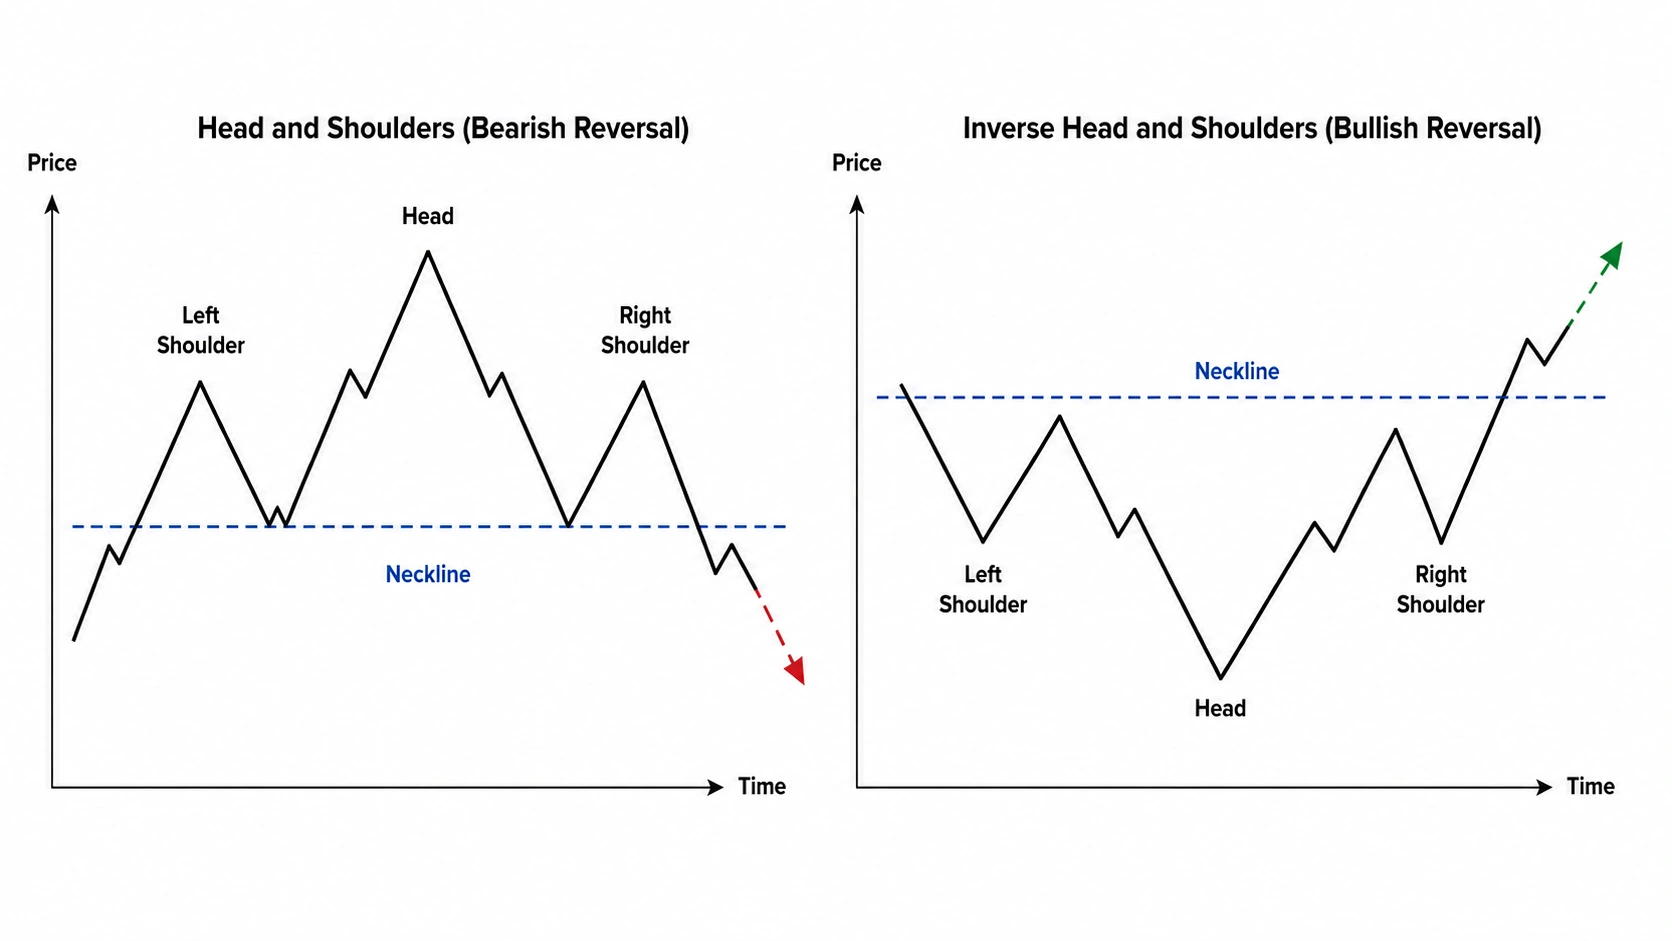
A Head and Shoulders pattern consists of three peaks, with the middle peak higher than the two surrounding peaks. Some traders interpret a break below the neckline as a possible bearish reversal. Conversely, an Inverse Head and Shoulders pattern is sometimes interpreted as a possible bullish reversal after a prolonged downtrend.
Figure 1. Head and Shoulders Diagram
This chart is provided for illustration and educational purposes only and does not represent financial advice, trading recommendations, or actual market signals.
2. Double Top
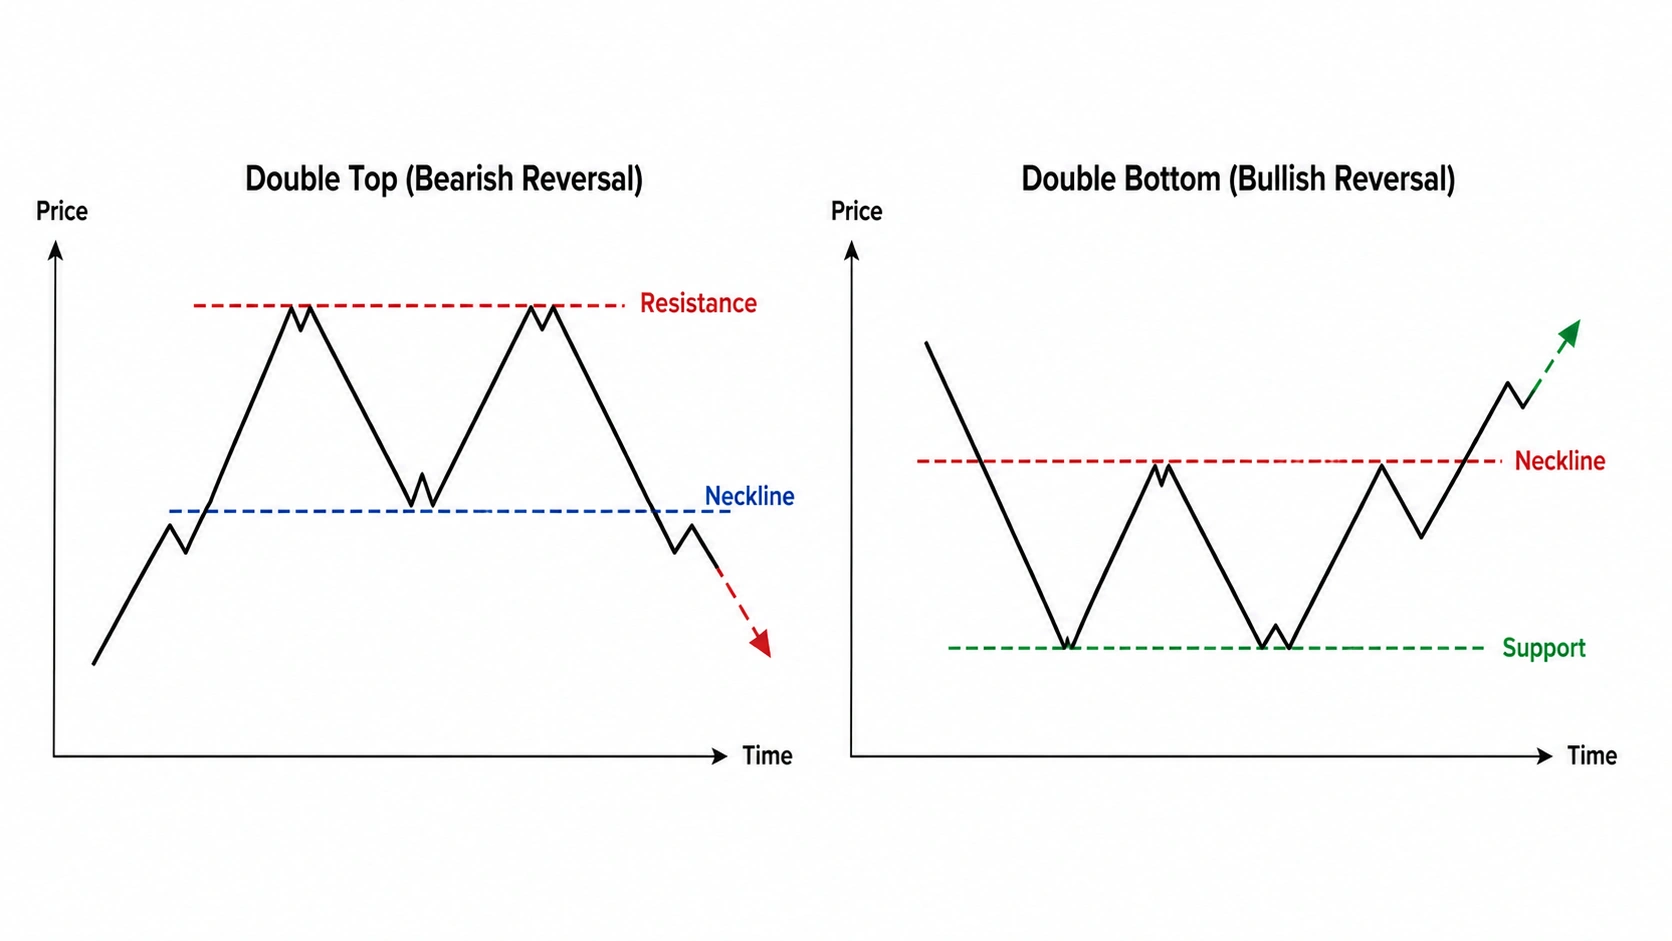
A Double Top occurs when the price reaches a similar high on two separate occasions before moving lower. Some traders interpret this as an indication that buying pressure may be weakening and that the market may struggle to move above that price level.
3. Double Bottom
A Double Bottom develops when the price reaches a similar low twice before moving higher. Some traders interpret this as a sign that selling pressure may be weakening and that buyers are beginning to regain control.
Figure 2. Double Top and Double Bottom Diagram
This chart is provided for illustration and educational purposes only and does not represent financial advice, trading recommendations, or actual market signals.
Common Continuation Patterns
1. Triangles
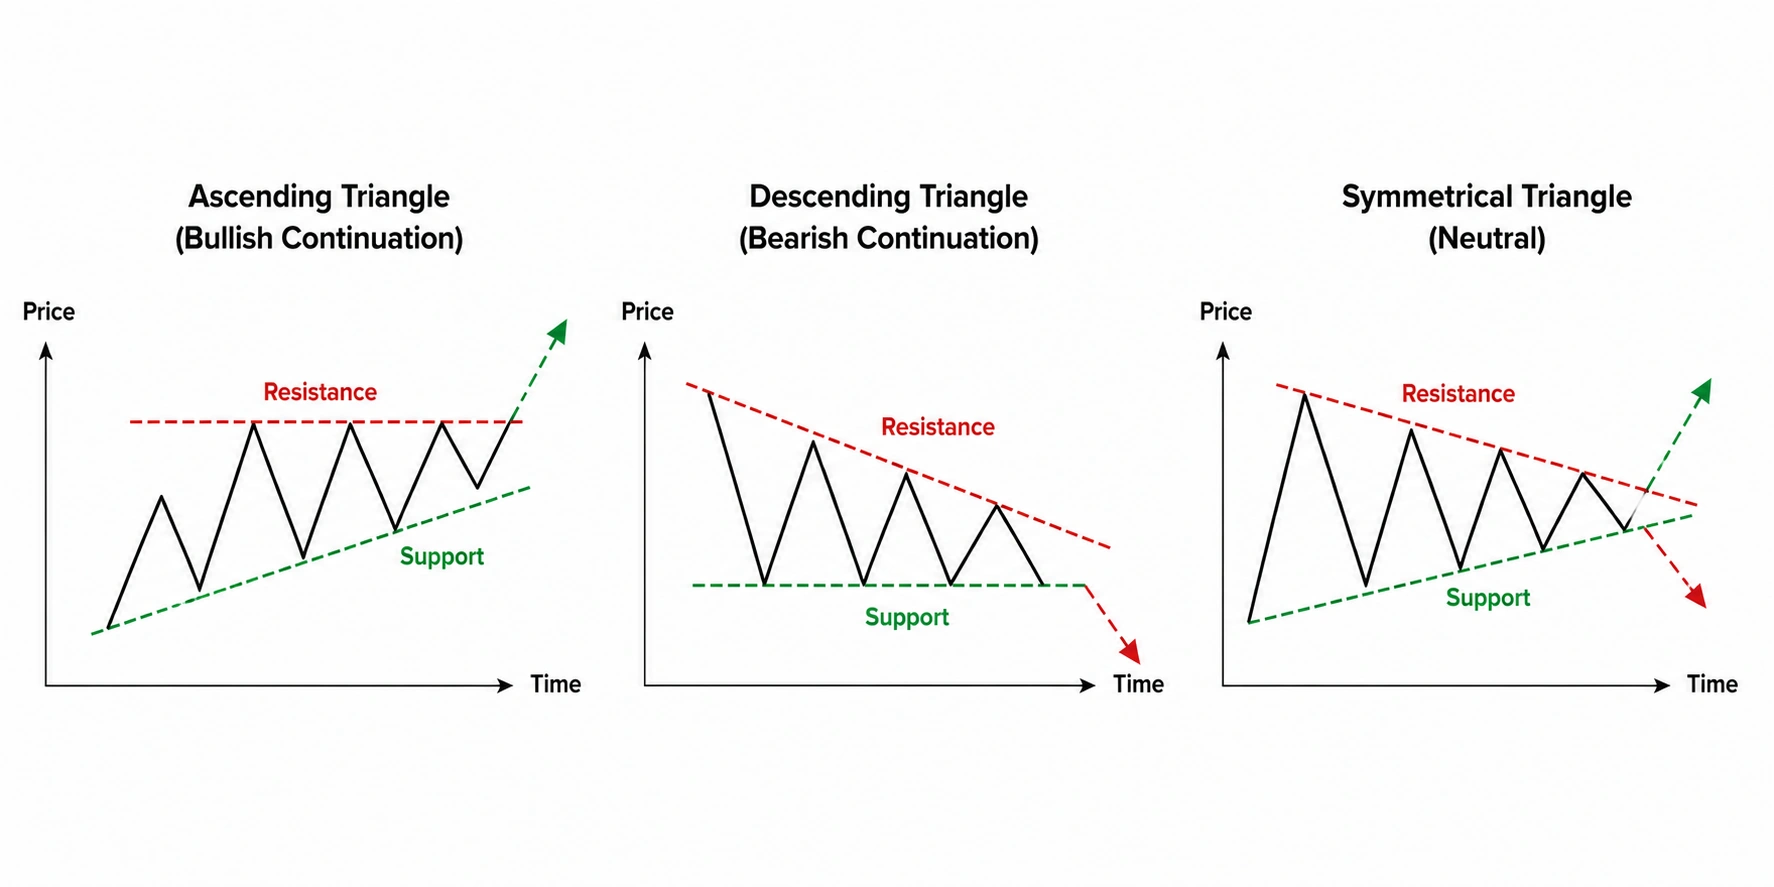
Triangle patterns develop as price movements narrow into a smaller range before a potential breakout. Common examples include ascending, descending and symmetrical triangles.
Figure 3. Triangle Patterns Diagram
This chart is provided for illustration and educational purposes only and does not represent financial advice, trading recommendations, or actual market signals.
2. Flags and Pennants
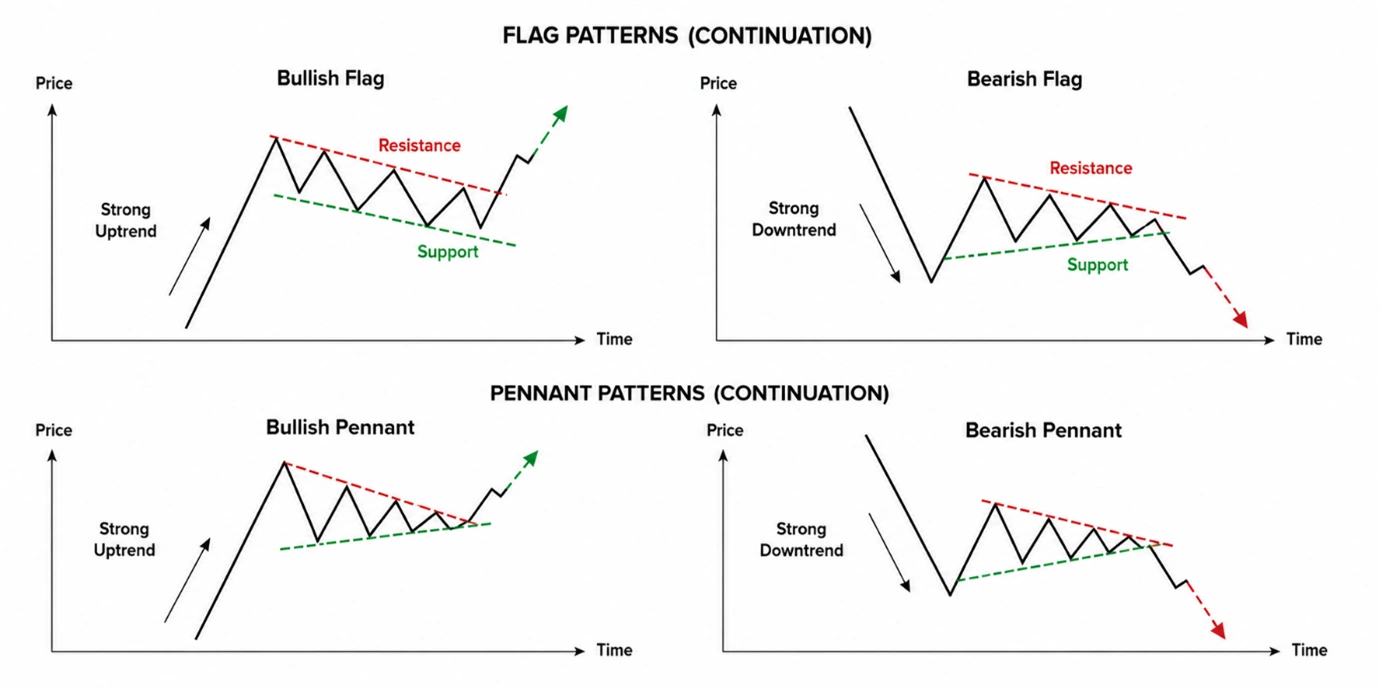
Flags and pennants often form after strong price movements and may indicate a temporary pause before the prevailing trend resumes. However, continuation is never guaranteed.
Figure 4. Flag and Pennant Diagram
This chart is provided for illustration and educational purposes only and does not represent financial advice, trading recommendations, or actual market signals.
Why Trading Volume Matters When Reading Chart Patterns
Many traders analyse trading volume alongside chart patterns to gauge the strength of buying or selling activity. Increasing trading volume during a breakout may provide additional confirmation that buying or selling pressure has strengthened.
Conversely, breakouts that occur on relatively low trading volume may prove less reliable and may simply reflect short term market noise. Although volume can provide additional context, it should not be viewed as a guarantee that a pattern will succeed.
Chart Patterns Example
A trader spots a clear Double Bottom pattern forming on a daily stock chart, suggesting that an upward reversal may be developing. Instead of immediately buying the asset, they wait for the price to close decisively above the confirmation level while trading volume also increases. By waiting for both signals, they reduce the risk of entering on a false breakout and gain greater confidence that buying momentum is strengthening.
Even with confirmation, no chart pattern is certain to succeed.
Why Chart Patterns Sometimes Fail
Chart patterns are based on historical price behaviour rather than certainty about future events. Unexpected economic news, company announcements, central bank interest rate decisions, geopolitical developments or sudden shifts in investor sentiment can all cause prices to move differently from what a pattern may have suggested.
For this reason, technical analysis should be viewed as a tool for assessing probabilities rather than predicting future prices.
How Professional Traders Use Chart Patterns
Professional traders rarely rely on chart patterns alone. Instead, they combine chart patterns with trend analysis, support and resistance levels, trading volume and disciplined risk management techniques.
The same chart patterns can appear on charts covering minutes, hours, days or even months. Many traders analyse multiple timeframes before making decisions, helping them build a broader view of market conditions.
By combining multiple forms of analysis, traders attempt to develop a more disciplined process and reduce exposure to emotional trading errors.
Bottom Line
Chart patterns are one of the most widely recognised tools in technical analysis because they help traders interpret how buying and selling behaviour develops over time.
Although patterns such as Head and Shoulders, Double Tops, Double Bottoms, Triangles and Flags are widely followed, they should never be viewed as guarantees of future market movements.
Understanding chart patterns is less about predicting the future and more about recognising how market psychology and investor behaviour can influence price movements. Like all forms of market analysis, chart patterns are most effective when used alongside other tools rather than in isolation. They should therefore be viewed as one component of a broader trading strategy rather than a standalone decision-making tool.