














Keltner Channels Explained: How ATR Creates Volatility Bands


Market volatility changes over time. During quieter periods, prices may move within smaller daily ranges. During more active periods, those ranges may expand as buying or selling becomes more pronounced.
Keltner Channels help illustrate these changes. The indicator places a moving average at the centre of the chart and surrounds it with two bands whose distance adjusts according to recent volatility.
The channels generally widen when volatility increases and narrow when volatility decreases. However, they describe historical price behaviour and do not predict whether the market will rise or fall next.
What Are Keltner Channels?
Keltner Channels are a technical indicator formed by three lines: a middle line based on a moving average, an upper channel above the moving average and a lower channel below the moving average.
Chester Keltner introduced the original channel concept in the 1960s. The modern version commonly used on charting platforms later evolved to use an exponential moving average and Average True Range.
A common setup uses a 20-period exponential moving average, known as an EMA, for the middle line. Average True Range, or ATR, determines the distance between this average and the outer channels.
These are common settings rather than fixed rules. Different platforms, instruments and timeframes may use different calculations.
How Are Keltner Channels Calculated?
An EMA gives greater weight to recent prices than older prices. This allows the middle line to respond more quickly to recent market movements than a simple moving average of the same length.
The upper channel is commonly calculated by adding ATR multiplied by the selected multiplier to the EMA. The lower channel is commonly calculated by subtracting ATR multiplied by the selected multiplier from the EMA.
Middle Line = EMA
Upper Channel = EMA + (ATR × Multiplier)
Lower Channel = EMA − (ATR × Multiplier)
If the multiplier is set to two, the upper channel is positioned two ATR values above the EMA and the lower channel is positioned two ATR values below it.
Changing the settings affects how the indicator behaves. A shorter moving average generally reacts more quickly, while a longer average produces a smoother middle line. A higher multiplier creates wider channels, while a lower multiplier places the bands closer to the average.
No single combination is appropriate for every market or timeframe.
Why Do the Channels Widen and Narrow?
Widening Channels
Keltner Channels generally widen when ATR rises. This means recent trading ranges are becoming larger.
Widening may occur during a sharp upward move, a rapid decline, a breakout from consolidation or a strong reaction to economic or company news.
Wider channels do not reveal market direction by themselves. They may develop while prices are rising or falling because ATR measures the size of price movements rather than their direction.
Narrowing Channels
The channels generally narrow when ATR falls and recent trading ranges become smaller.
This may occur during consolidation, sideways trading or a calmer period following a volatile move.
Narrow channels do not guarantee that a breakout is approaching. They only show that recent price movements have become smaller relative to the period used in the calculation.
Reading Price Within the Channels
The position of price within the channels can provide context about recent market behaviour.
Price trading above the middle line may indicate that recent movement is stronger on the upside, while price below the middle line may reflect stronger downward movement.
Repeated movement towards the upper channel may occur during an upward trend. Similarly, price may remain near the lower channel during a sustained downward trend. When price repeatedly crosses the middle line, the market may be experiencing less consistent directional movement.
These observations depend on the wider price structure. A touch or close above the upper channel does not automatically mean that price is about to fall. During a strong upward move, price can remain near the upper band for several periods.
Movement below the lower channel does not automatically mean that price will rise. Outer channel touches and crossings should not be treated as automatic entry, exit or reversal signals.
Keltner Channels in Practice
XAU/USD Daily Chart with Keltner Channels (20, 2)
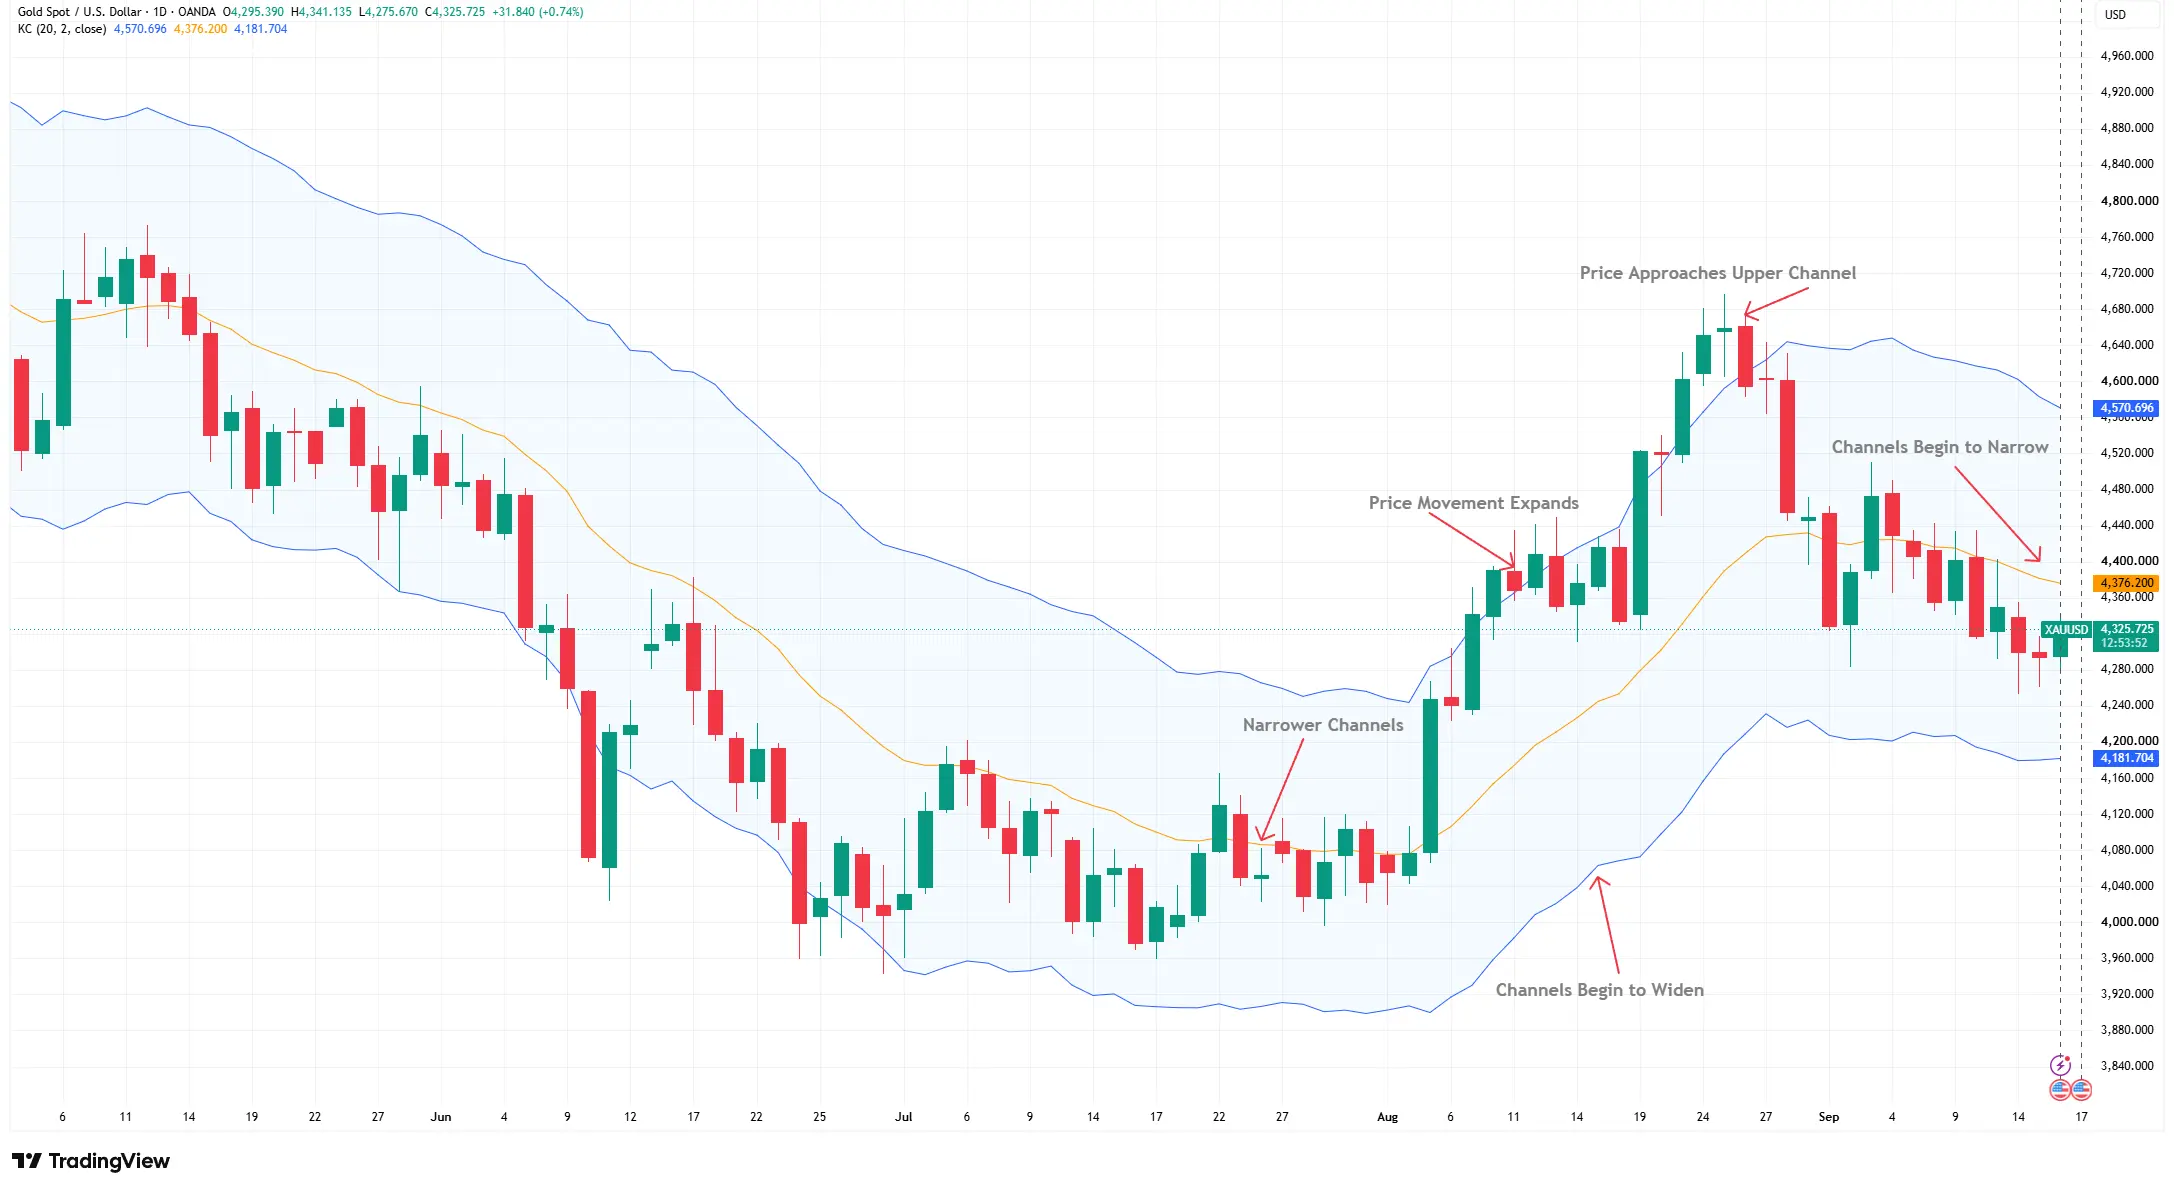
Source: TradingView. Past performance is not a reliable indicator of future performance. Data as of 16 September 2026.
Keltner Channels remain relatively narrow during quieter trading in July and early August before widening as XAU/USD price movement and ATR increase during August. The channels begin narrowing again in September as recent volatility eases.
The chart shows narrower channels during quieter trading in July and early August, followed by widening channels as price movement and ATR increase during August. Price later approaches the upper channel before the bands begin narrowing again in September as recent volatility eases.
During July and early August, prices remain relatively closely grouped and the distance between the upper and lower channels becomes smaller. This reflects a period of lower recent volatility.
Price movement begins to expand in August as XAU/USD rises more strongly. The larger daily ranges increase ATR, causing the outer channels to move farther away from the middle line. As the upward movement continues, price approaches the upper channel during late August. This shows that price is trading near the upper boundary of its recent volatility range. It does not establish that the market is overextended or about to reverse.
In September, the distance between the outer channels begins to decrease as recent volatility eases. This later narrowing describes a change in current market conditions rather than predicting the direction of the next movement.
Limitations of Keltner Channels
Keltner Channels are based on historical price data. Both the moving average and ATR react after market conditions have changed.
Widening channels do not guarantee that volatility will remain elevated, while narrowing channels do not confirm that a breakout is approaching. Price touching an outer channel does not automatically indicate a reversal, and a close outside the channel does not guarantee that the movement will continue.
Results can also vary considerably when the moving average length, ATR length or multiplier is changed. The same settings may behave differently across instruments and timeframes.
Keltner Channels may be considered alongside price action, support and resistance, market structure and relevant economic events. Combining analytical tools does not eliminate false signals or unexpected market movements.
Bottom Line
Keltner Channels combine a moving average with ATR-based volatility bands to show how recent price ranges are changing around an average. Wider channels generally reflect higher recent volatility, while narrower channels indicate that price ranges have become smaller.
The indicator can also provide context for where price is trading relative to its recent volatility range, but it does not predict market direction or confirm that a breakout, continuation or reversal will occur.
Like all technical indicators, Keltner Channels are based on historical price behaviour and are most useful when interpreted alongside wider price action, market structure and relevant market conditions.