














Standard Deviation Explained: How It Measures Market Volatility


Financial markets do not always move at the same pace. During quieter periods, prices may remain relatively close together. At other times, movements become larger and prices become more widely dispersed.
Standard deviation is a statistical measure of this dispersion. When applied to market prices, it can help traders assess whether recent price variation is relatively limited or elevated.
However, standard deviation measures dispersion, not direction. A rising reading can accompany either an upward or downward move and does not indicate what price will do next.
What Is Standard Deviation?
Standard deviation measures how widely a group of values is distributed around its average, also known as the mean.
When applied to a price chart:
- A lower reading means the selected prices are relatively close to their average.
- A higher reading means the selected prices are more widely dispersed around their average.
Charting platforms calculate standard deviation over a selected number of periods. A period represents one candle, so 20 periods on a daily chart means 20 daily candles. On an hourly chart, the same setting represents 20 hourly candles.
A 20-period setting is commonly used, partly because it is also widely used in the conventional Bollinger Bands calculation. It is a reference setting rather than a universal rule. Traders may use different settings depending on the instrument and timeframe being examined.
Reading Higher and Lower Standard Deviation
Higher Standard Deviation
A higher or rising standard deviation means recent prices are becoming more widely dispersed around their average.
This may occur during a sharp rally, a rapid decline, a breakout from consolidation or a strong reaction to an economic announcement. It may also rise when large movements occur in both directions.
A rising reading is not automatically bullish. Standard deviation responds to the size and distribution of price movements, not whether buyers or sellers are dominant.
Lower Standard Deviation
A lower or falling standard deviation means recent prices are becoming more closely grouped around their average.
This may be seen during consolidation, sideways trading or a calmer period following a volatile move. It indicates that the degree of recent price variation has decreased.
Low standard deviation does not guarantee that a breakout is approaching. Unexpected news can cause market conditions to change quickly, but the historical reading cannot predict when this will happen.
Standard Deviation and Volatility
Standard deviation is commonly used as a measure of volatility because greater dispersion generally accompanies larger price fluctuations.
However, standard deviation is not the same as price range. Range measures only the distance between the highest and lowest values. Standard deviation considers how all the selected values are distributed around their average.
Two periods could therefore have a similar overall range but different standard deviation readings. Prices may be concentrated near the centre of one range while being more widely distributed within another.
Volatility itself is not automatically positive or negative. It describes the degree of movement rather than its direction or desirability.
Standard Deviation in Practice
XAU/USD daily chart with Standard Deviation (20), May to September 2026
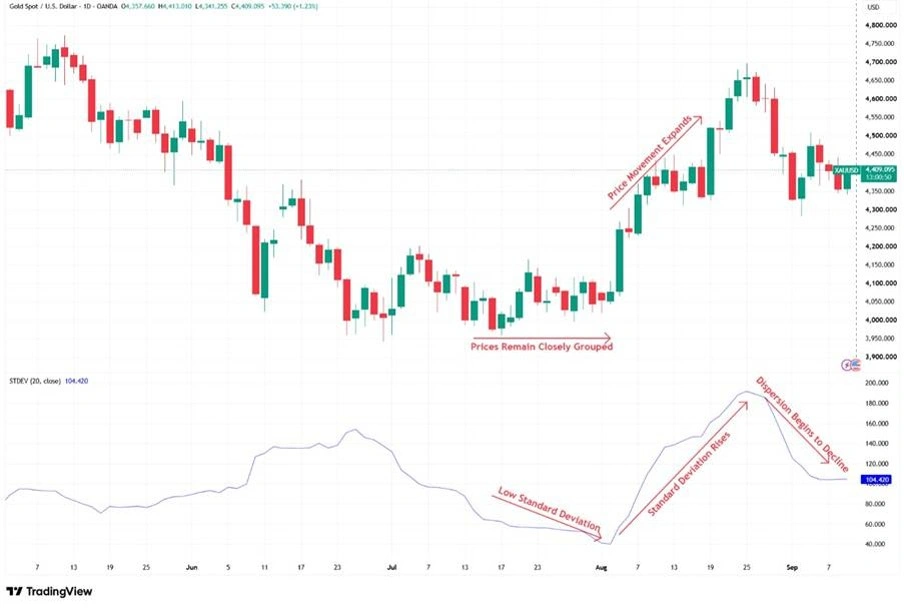
Source: TradingView. Past performance is not a reliable indicator of future performance. Data accurate as of 9 September 2026.
Standard deviation remains relatively low while closing prices are more closely grouped in July and early August. It rises as price movements expand during August before declining as recent price dispersion begins to ease.
From mid-July to early August, XAU/USD traded within a comparatively limited range. During this period, the Standard Deviation indicator declined to a relatively low level, showing that recent closing prices had become more closely grouped around their 20-period average.
Price movements expanded during August as gold moved sharply higher. Standard deviation increased at the same time as closing prices became more widely dispersed. The indicator peaked in late August before declining into September as recent price dispersion began to ease.
Importantly, the indicator describes changes that have already occurred. Its rise did not predict the upward move, and its subsequent decline does not indicate whether gold will rise or fall next.
Standard Deviation vs Average True Range
Standard deviation and Average True Range (ATR) can both provide information about market volatility, but they measure it differently.
Standard deviation measures how widely selected prices are dispersed around their average. ATR, by contrast, measures the average trading range over a selected period, taking gaps between trading sessions into account through its true range calculation.
This means the two indicators can provide different perspectives on changing market conditions. Standard deviation focuses on dispersion around an average, while ATR focuses on the size of recent price ranges. Neither indicator shows whether prices will move higher or lower.
Limitations of Standard Deviation
Standard deviation is calculated from historical information and reacts after price dispersion changes. A high reading does not mean volatility has peaked, while a low reading does not prove that conditions will remain calm.
The result also depends on the timeframe, calculation length, price source and platform settings. Sudden economic, political or company developments may cause future conditions to differ substantially from the historical period.
Standard deviation treats upward and downward variation alike. It does not distinguish favourable movement from adverse movement or represent every form of market risk.
Financial prices and returns also do not always follow a normal distribution, particularly during extreme market events. It would therefore be misleading to guarantee that prices will remain within a particular number of standard deviations.
Standard deviation should therefore be interpreted relative to the instrument, timeframe and historical period being analysed rather than against a universal “high” or “low” threshold.
Bottom Line
Standard deviation measures how widely recent prices are dispersed around their average. Higher readings indicate greater dispersion, while lower readings show that prices are more closely grouped.
It provides information about volatility rather than direction. The indicator is most useful when compared with the instrument’s own history and considered alongside price action, market structure and relevant market events.
Like all technical indicators, standard deviation is based on historical price behaviour and does not predict what the market will do next.