














Fibonacci Retracements Explained: How Traders Measure Price Pullbacks


Prices rarely move continuously in one direction. Even during an established trend, periods of upward or downward movement are often interrupted by temporary moves in the opposite direction.
These temporary movements are known as retracements or pullbacks. Fibonacci retracements provide percentage-based reference levels that traders can use to measure how far price has moved back through an earlier rise or decline.
The levels identify areas traders may monitor as possible support or resistance. However, they do not predict that price will stop, reverse or resume its previous direction.
Retracement vs Reversal: What’s the Difference?
A retracement is a temporary movement against the direction of a preceding price move.
During an upward trend, price may decline temporarily before potentially continuing higher. During a downward trend, price may rise temporarily before potentially continuing lower.
A retracement differs from a reversal. A retracement is a temporary interruption, while a reversal represents a more lasting change in direction. However, the distinction is not always clear when the movement begins. Further price action is normally required before traders can determine whether a pullback remained temporary or developed into a broader reversal.
What Are Fibonacci Retracements?
Fibonacci retracements divide a selected price move into percentage levels. The commonly displayed levels include:
- 23.6%
- 38.2%
- 50%
- 61.8%
- 78.6%
The Fibonacci sequence begins with 0 and 1, with each subsequent number formed by adding the previous two numbers. Relationships between numbers in this sequence produce ratios including 23.6%, 38.2% and 61.8%. Some technical analysts apply these ratios to price charts to identify potential areas of support or resistance.
The 50% level is also commonly included, although it is not derived from the Fibonacci sequence. It represents the halfway point of the selected price move.
Each percentage shows how much of the earlier move price has retraced. If a market rises from 100 to 120 and then declines to 110, it has retraced 50% of the original 20-point rise.
These percentages provide reference areas. Price is not required to react when it reaches them.
How to Draw Fibonacci Retracement Levels
The Fibonacci retracement tool is applied between two visible extremes on a chart. These are commonly described as a swing low and a swing high.
A swing low is a visible low from which price subsequently moved higher. A swing high is a visible high from which price subsequently moved lower.
Following an upward move, the tool is normally drawn from the relevant swing low to the swing high. The resulting levels show how far price has moved down through the earlier rise.
Following a downward move, it is drawn from the swing high to the swing low. The levels then measure an upward retracement through the earlier decline.
The charting platform divides the distance between the selected points using horizontal percentage levels. Choosing the starting and ending points requires judgement. Different traders may select different price swings and therefore produce different levels.
What Do the Fibonacci Retracement Levels Mean?
A 23.6% retracement represents a relatively shallow pullback. It shows that price has moved back through less than one quarter of the preceding move.
The 38.2% level represents a more noticeable retracement, while the 50% level marks the halfway point. These areas are often monitored to see whether the previous direction begins to reappear.
The 61.8% level is associated with the golden ratio and is one of the most widely recognised Fibonacci levels. A 78.6% reading represents a deeper pullback in which price has retraced most of the earlier movement.
These descriptions do not mean that one level is universally more reliable than another. Price can turn before reaching a level, move slightly beyond it, consolidate around it or continue through it without a meaningful reaction.
A deep retracement does not automatically invalidate the earlier trend. Similarly, a shallow retracement does not guarantee that the trend will continue.
Fibonacci Retracements in Practice: XAU/USD Example
XAU/USD Daily Chart with Fibonacci Retracement Levels
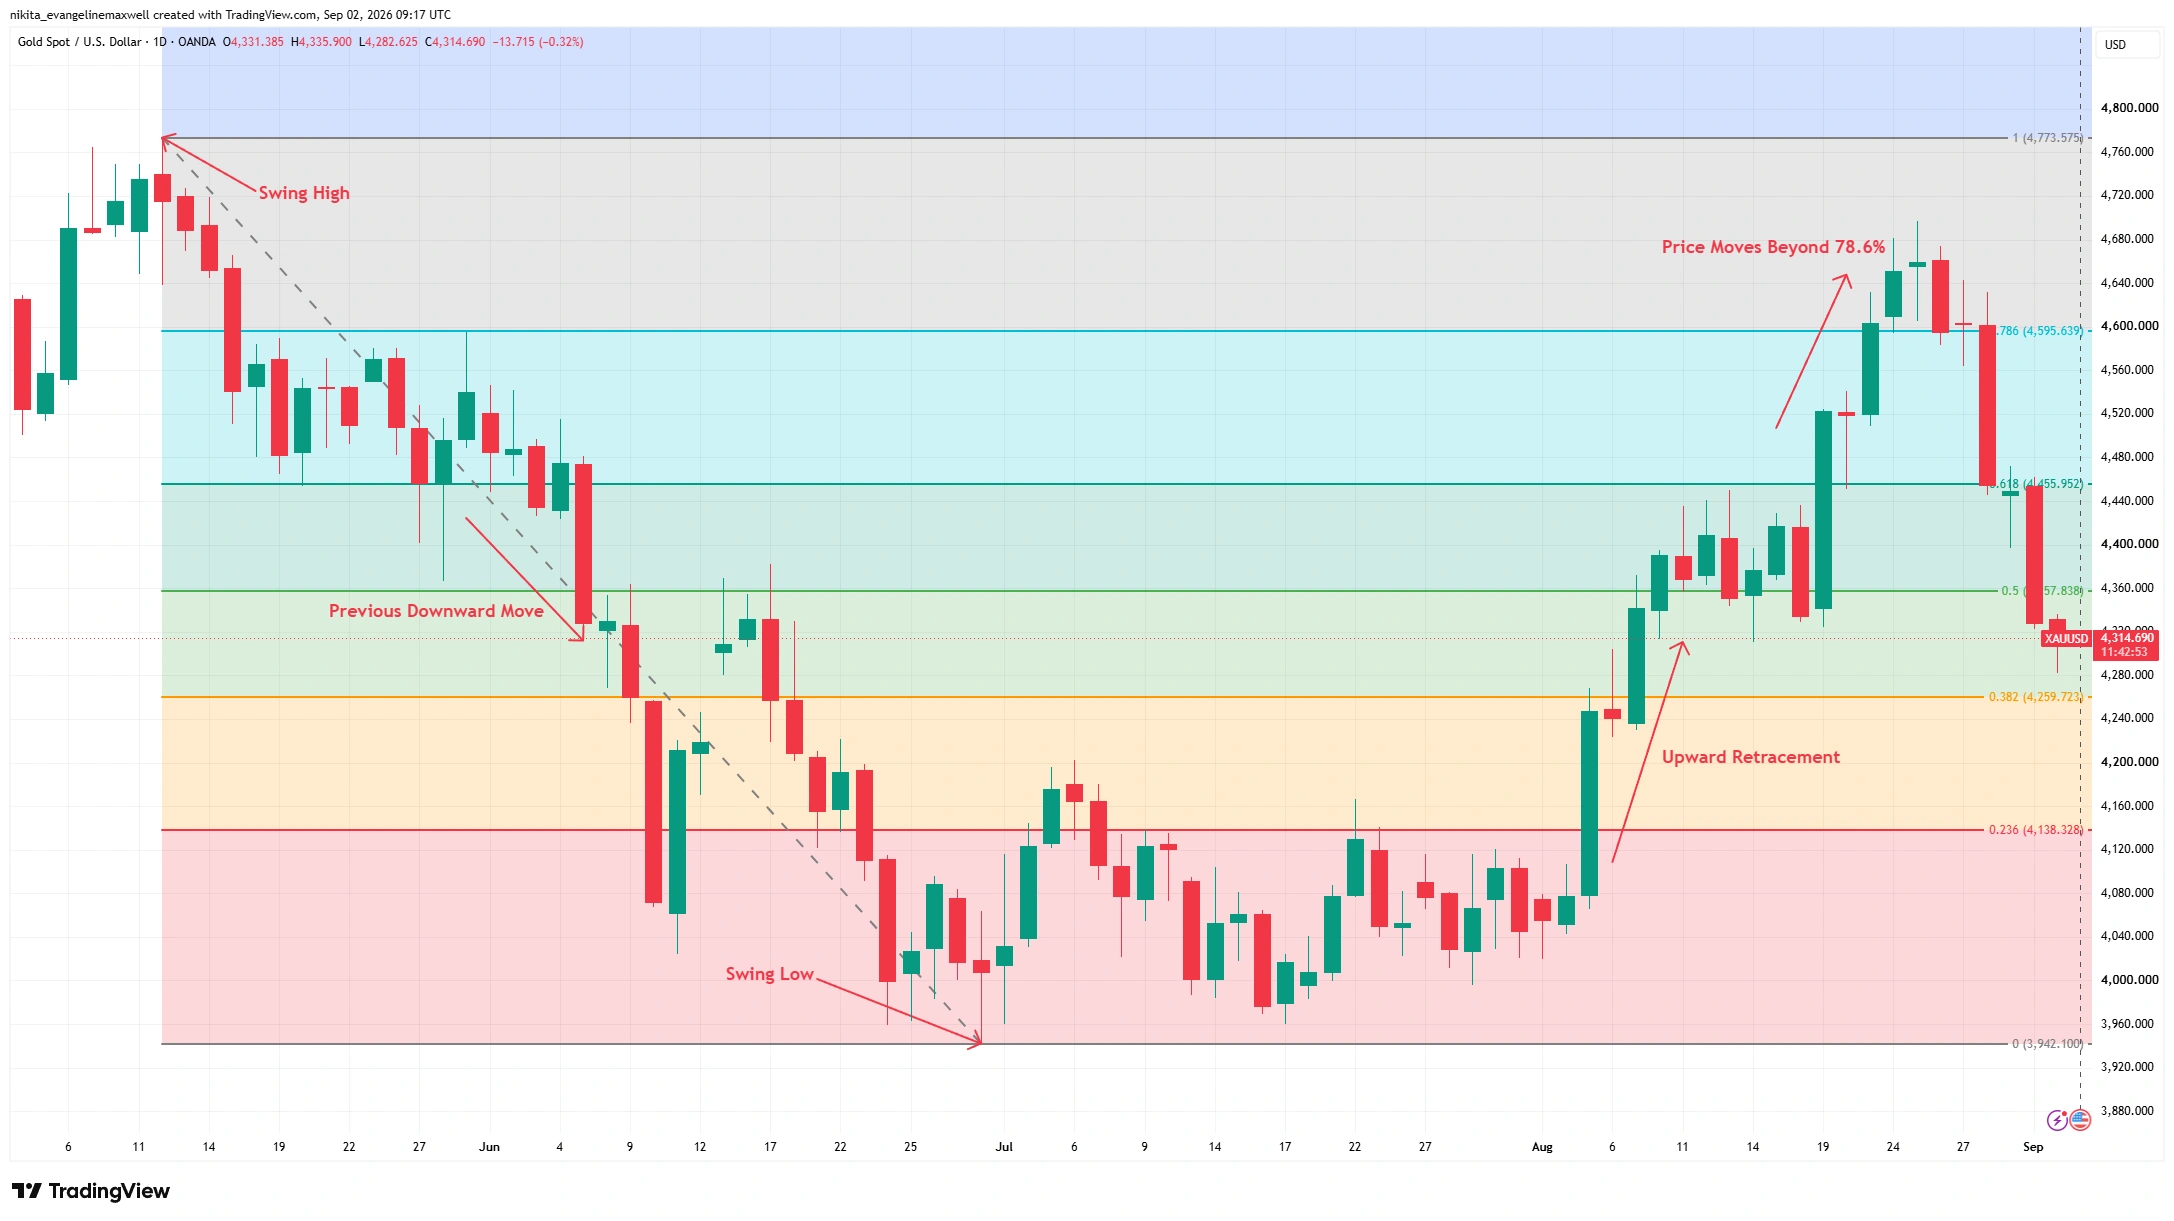
Source & Methodology: TradingView. Fibonacci retracement levels are drawn from the 12 May 2026 swing high of approximately $4,773.58 to the 30 June 2026 swing low of approximately $3,942.10. The chart uses daily candlesticks and displays the 23.6%, 38.2%, 50%, 61.8% and 78.6% retracement levels. The annotations are provided for educational purposes only. Fibonacci levels are historical reference areas and do not predict future price movements. Past performance is not a reliable indicator of future performance. Data accurate as of 2 September 2026.
Fibonacci levels are applied to the downward move from the 12 May swing high to the 30 June swing low. Price subsequently recovers through several percentage levels and moves beyond the 78.6% retracement area in late August before declining.
Following uneven price movement during July, XAU/USD begins recovering in early August. Price rises through the 23.6% level at approximately $4,138.33 and the 38.2% level at approximately $4,259.72. It then moves through the 50% level at approximately $4,357.84 and the 61.8% level at approximately $4,455.95.
The recovery later moves beyond the 78.6% retracement level at approximately $4,595.64. Price approaches, but does not return to, the original swing high before declining towards the end of August and into early September.
This sequence demonstrates how Fibonacci levels can divide an earlier price move into reference areas. It does not establish that the levels caused these movements or predicted where the recovery would end.
Limitations of Fibonacci Retracements
The selection of swing points is subjective, meaning different traders can produce different retracement levels from the same chart.
The tool is also based entirely on historical price movement. It cannot account for unexpected economic announcements, company developments or changes in market sentiment.
A reaction near a Fibonacci level does not prove that the level caused it. Price may be responding to other technical or fundamental factors. Fibonacci levels also cannot reliably distinguish between a temporary pullback and a genuine reversal.
For these reasons, Fibonacci levels should not be treated as standalone buy or sell signals. They can instead be considered alongside price action, support and resistance, trendlines, market structure and other relevant information.
Bottom Line
Fibonacci retracements measure how far price has moved back through a selected rise or decline. Common reference levels include 23.6%, 38.2%, 50%, 61.8% and 78.6%, although the 50% level is not derived from the Fibonacci sequence.
The tool is drawn between a relevant swing low and swing high, with the direction depending on the preceding price move. Because selecting those points involves judgement and price can move through any Fibonacci level, the resulting lines are best understood as reference areas rather than predictions.
Fibonacci retracements can help traders describe pullbacks within the context of wider price action and market structure. They cannot determine whether a trend will resume or whether a developing pullback will become a reversal.