














ADX Indicator Explained: Is the Market Trending or Moving Sideways?


Financial markets do not always move in a clear direction. At times, prices rise or fall consistently, forming a recognisable trend. At other times, they move sideways as buyers and sellers struggle to take control.
The Average Directional Index, commonly known as ADX, helps traders assess the strength of this directional movement. It can indicate whether a trend is becoming stronger or weaker, but it does not show whether prices are moving higher or lower.
A rising or elevated ADX can therefore appear during either an upward or downward trend. Price and the accompanying directional indicators are needed to understand the direction of the move.
What Is the ADX Indicator?
ADX stands for Average Directional Index. It was developed by technical analyst J. Welles Wilder Jr. as part of his Directional Movement System.
The indicator measures the strength of a market trend over a selected number of periods. It normally appears as a line in a separate panel below the price chart.
A 14-period setting is commonly used, although traders may adjust it depending on the instrument and timeframe being analysed. TradingView uses 14 periods as the default setting for both the ADX calculation and the directional indicators in its Directional Movement Index tool.
The basic interpretation is:
- A rising ADX suggests that directional movement is strengthening.
- A falling ADX suggests that directional movement is weakening.
- ADX does not show whether the market is moving higher or lower.
A high ADX is not automatically bullish, and a low ADX is not automatically bearish.
How to Read the ADX Scale
ADX is normally displayed on a scale from 0 to 100. Traders often use broad reference levels to help interpret its readings:
- Below 20 may suggest weak directional movement or sideways conditions.
- Between 20 and 25 may indicate that directional movement is beginning to strengthen.
- Above 25 may suggest a more established trend.
- Above 40 may indicate particularly strong directional movement.
These levels are guidelines rather than fixed rules. They may behave differently depending on the instrument, timeframe and market environment.
The movement of the ADX line can sometimes provide more useful context than the exact reading. For example, ADX rising from 15 to 22 suggests that directional movement is strengthening, even though the reading remains close to the commonly watched 20 to 25 area.
Crossing either level does not create an automatic trading signal.
What Does Rising or Falling ADX Mean?
Rising ADX
When ADX rises, directional movement is strengthening. This may occur during an upward trend, a downward trend or a directional move following a period of consolidation.
For example, ADX may rise after price leaves a trading range and begins forming a clearer series of higher highs and higher lows. It can also rise during a sharp decline as selling pressure strengthens.
The price chart or directional lines must be examined to determine whether the trend is upward or downward.
Falling ADX
When ADX falls, the existing directional movement is losing strength. This may happen as a trend slows, price begins consolidating or the market returns to sideways conditions.
Falling ADX does not automatically mean that price is reversing. The market may pause before continuing in the same direction, or the trend may continue at a slower pace.
Similarly, low ADX does not guarantee that a breakout is approaching. It only indicates that recent price movement has lacked a strong and consistent direction.
What Are +DI and −DI in the ADX Indicator?
ADX is often displayed as part of the Directional Movement Index, or DMI. This includes two additional lines:
- The Positive Directional Indicator, known as +DI
- The Negative Directional Indicator, known as −DI
+DI reflects positive directional movement, while −DI reflects negative directional movement. Their relative position can help indicate which direction is currently dominant.
When +DI is above −DI, upward directional movement is stronger than downward directional movement. When −DI is above +DI, downward directional movement is stronger.
These lines provide direction, while ADX measures the strength of the directional movement. Therefore:
- Rising ADX with +DI above −DI may accompany a strengthening upward trend.
- Rising ADX with −DI above +DI may accompany a strengthening downward trend.
Crossings between +DI and −DI can occur frequently when the market is moving sideways. They should not be treated as automatic buy or sell signals because repeated crossings may produce misleading indications when no clear trend is present.
How to Read ADX on a Price Chart
XAU/USD daily chart with the Directional Movement Index (14), May to August 2026
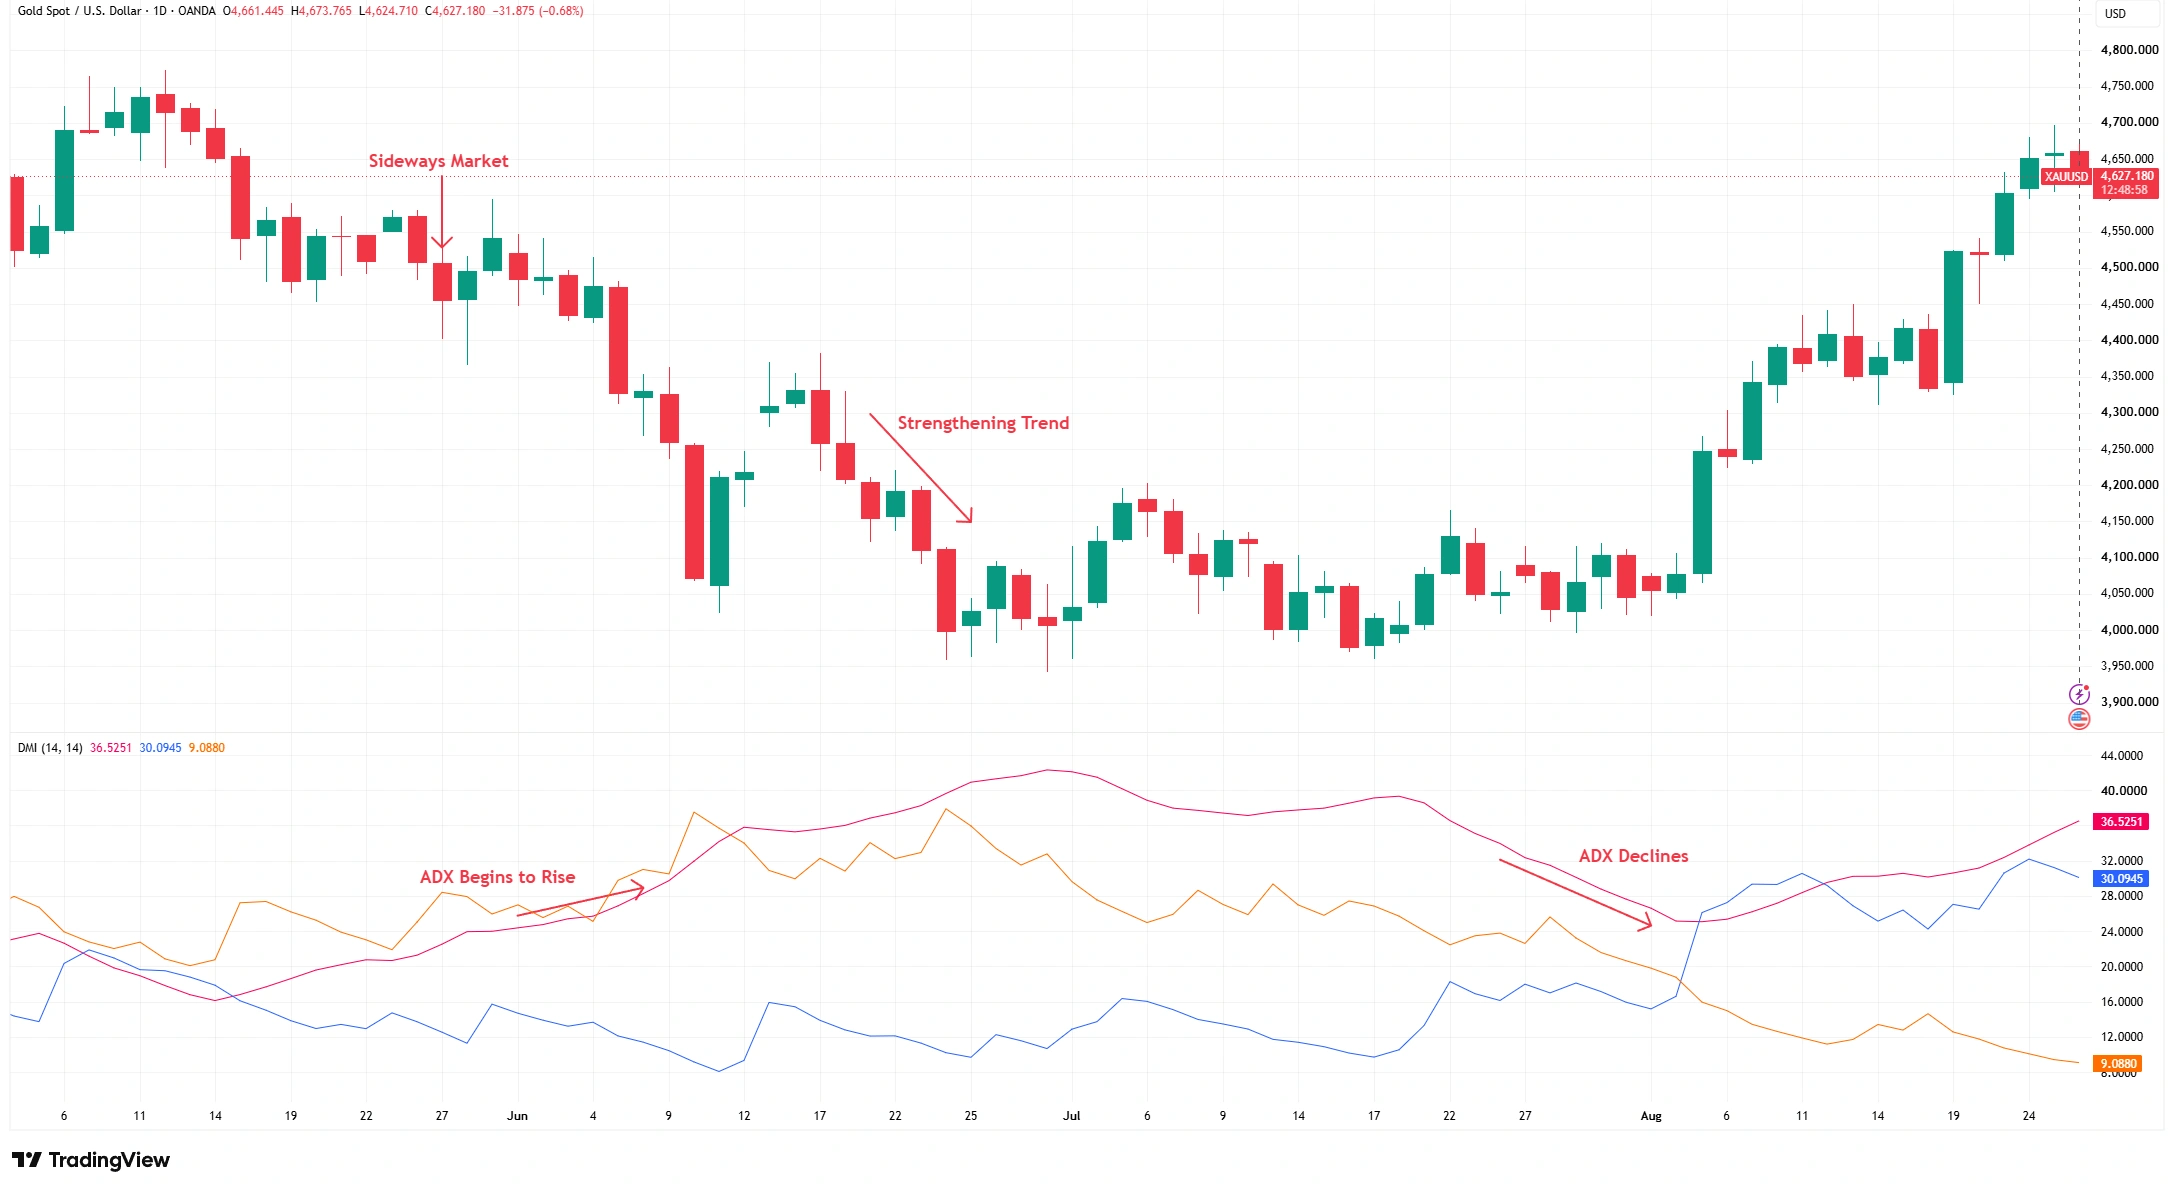
Source: TradingView. Past performance is not a reliable indicator of future performance. Data accurate as of 26 August 2026.
During the strengthening downtrend, the orange −DI line remains above the blue +DI line while the pink ADX line rises. ADX subsequently declines as the downward movement loses strength. In August, +DI moves above −DI and ADX begins rising again as the upward movement strengthens.
Limitations of the ADX Indicator
ADX is based on historical price information and reacts after market conditions change. A high reading does not guarantee that a trend will continue, while a falling reading does not prove that a reversal is beginning.
The commonly watched levels of 20, 25 and 40 should be treated as general reference areas rather than exact boundaries. ADX readings may also behave differently across instruments and timeframes.
Crossings between +DI and −DI may provide misleading indications during sideways markets. For this reason, ADX and its directional lines should not be treated as standalone buy or sell signals.
The Bottom Line
ADX helps traders assess the strength of directional price movement rather than its direction. A rising ADX suggests directional movement is strengthening, while a falling ADX indicates that it is weakening.
The +DI and −DI lines provide additional context about whether positive or negative directional movement is dominant. Together, these indicators can help traders distinguish between stronger trends and less directional or sideways market conditions.
However, ADX is based on historical price data and should be considered alongside price action and other forms of market analysis rather than used as a standalone trading signal.