














Average True Range: How to Measure Market Volatility


Financial markets do not always move at the same pace. During quieter periods, prices may change only slightly from one day to the next. At other times, economic announcements, unexpected news or changing market sentiment can cause much larger movements.
This changing pace is known as volatility, which describes the size of price movements rather than whether the market is moving higher or lower.
Average True Range, commonly known as ATR, is a technical indicator that helps traders measure this volatility. It shows how much an instrument has typically moved over a selected period but does not predict whether price will rise or fall.
What Is Average True Range?
Average True Range was developed by technical analyst J. Welles Wilder Jr. It measures the average range of price movement over a selected number of periods.
ATR is displayed as a line in a separate panel below a price chart. The most commonly used setting is 14 periods, although this can be adjusted according to the market and timeframe being analysed.
The basic interpretation is straightforward:
- A rising ATR shows that price movements are becoming larger, and volatility is increasing.
- A falling ATR shows that price movements are becoming smaller, and volatility is decreasing.
- ATR does not indicate whether the market is bullish or bearish.
A high ATR is not automatically negative, just as a low ATR is not automatically positive. The indicator only describes the size of recent price movements.
How Is ATR Calculated?
ATR begins by calculating the “true range” for each period. The true range is the greatest of three measurements:
- The distance between the current high and current low
- The distance between the current high and the previous close
- The distance between the current low and the previous close
The second and third measurements allow the indicator to account for gaps or sharp moves between one period’s close and the next period’s trading range.
For example, the price may close at 100 before opening much higher the following day. Looking only at the new day’s high and low would miss part of that movement. Comparing the new range with the previous close provides a more complete measure of volatility.
True Range = the greatest of:
- Current High − Current Low
- |Current High − Previous Close|
- |Current Low − Previous Close|
ATR then uses these true range values to create an average over a selected period, commonly 14 periods. Wilder’s original method applies a smoothed calculation, giving traders a continuously updated view of recent volatility.
If an index has a 14-day ATR of 50 points, this means its average true range has been approximately 50 points per day over that period. It does not mean the index is expected to rise or fall by exactly 50 points the following day.
Reading Rising and Falling ATR
Rising ATR
When ATR rises, recent price ranges are becoming larger. This means market volatility is increasing.
Rising ATR may be seen during a breakout, a sharp trend or a period of uncertainty. It can also occur following an economic announcement, company result or unexpected event.
Importantly, ATR can rise when price is moving in either direction. A strong upward move can produce a rising ATR, but so can a sharp decline. The indicator measures the size of the movement, not its direction.
Falling ATR
When ATR falls, recent price ranges are becoming smaller. This means volatility is decreasing.
Falling ATR is often seen during consolidation or sideways trading, when daily candles become smaller and price remains within a narrower range. It may also occur after a volatile period as market conditions begin to settle.
A falling ATR does not reveal what price will do next. It does not guarantee that a breakout is approaching or identify the direction of any future move. It only shows that recent price movements have become smaller.
ATR in Practice
XAU/USD daily chart with Average True Range (14), January to July 2026
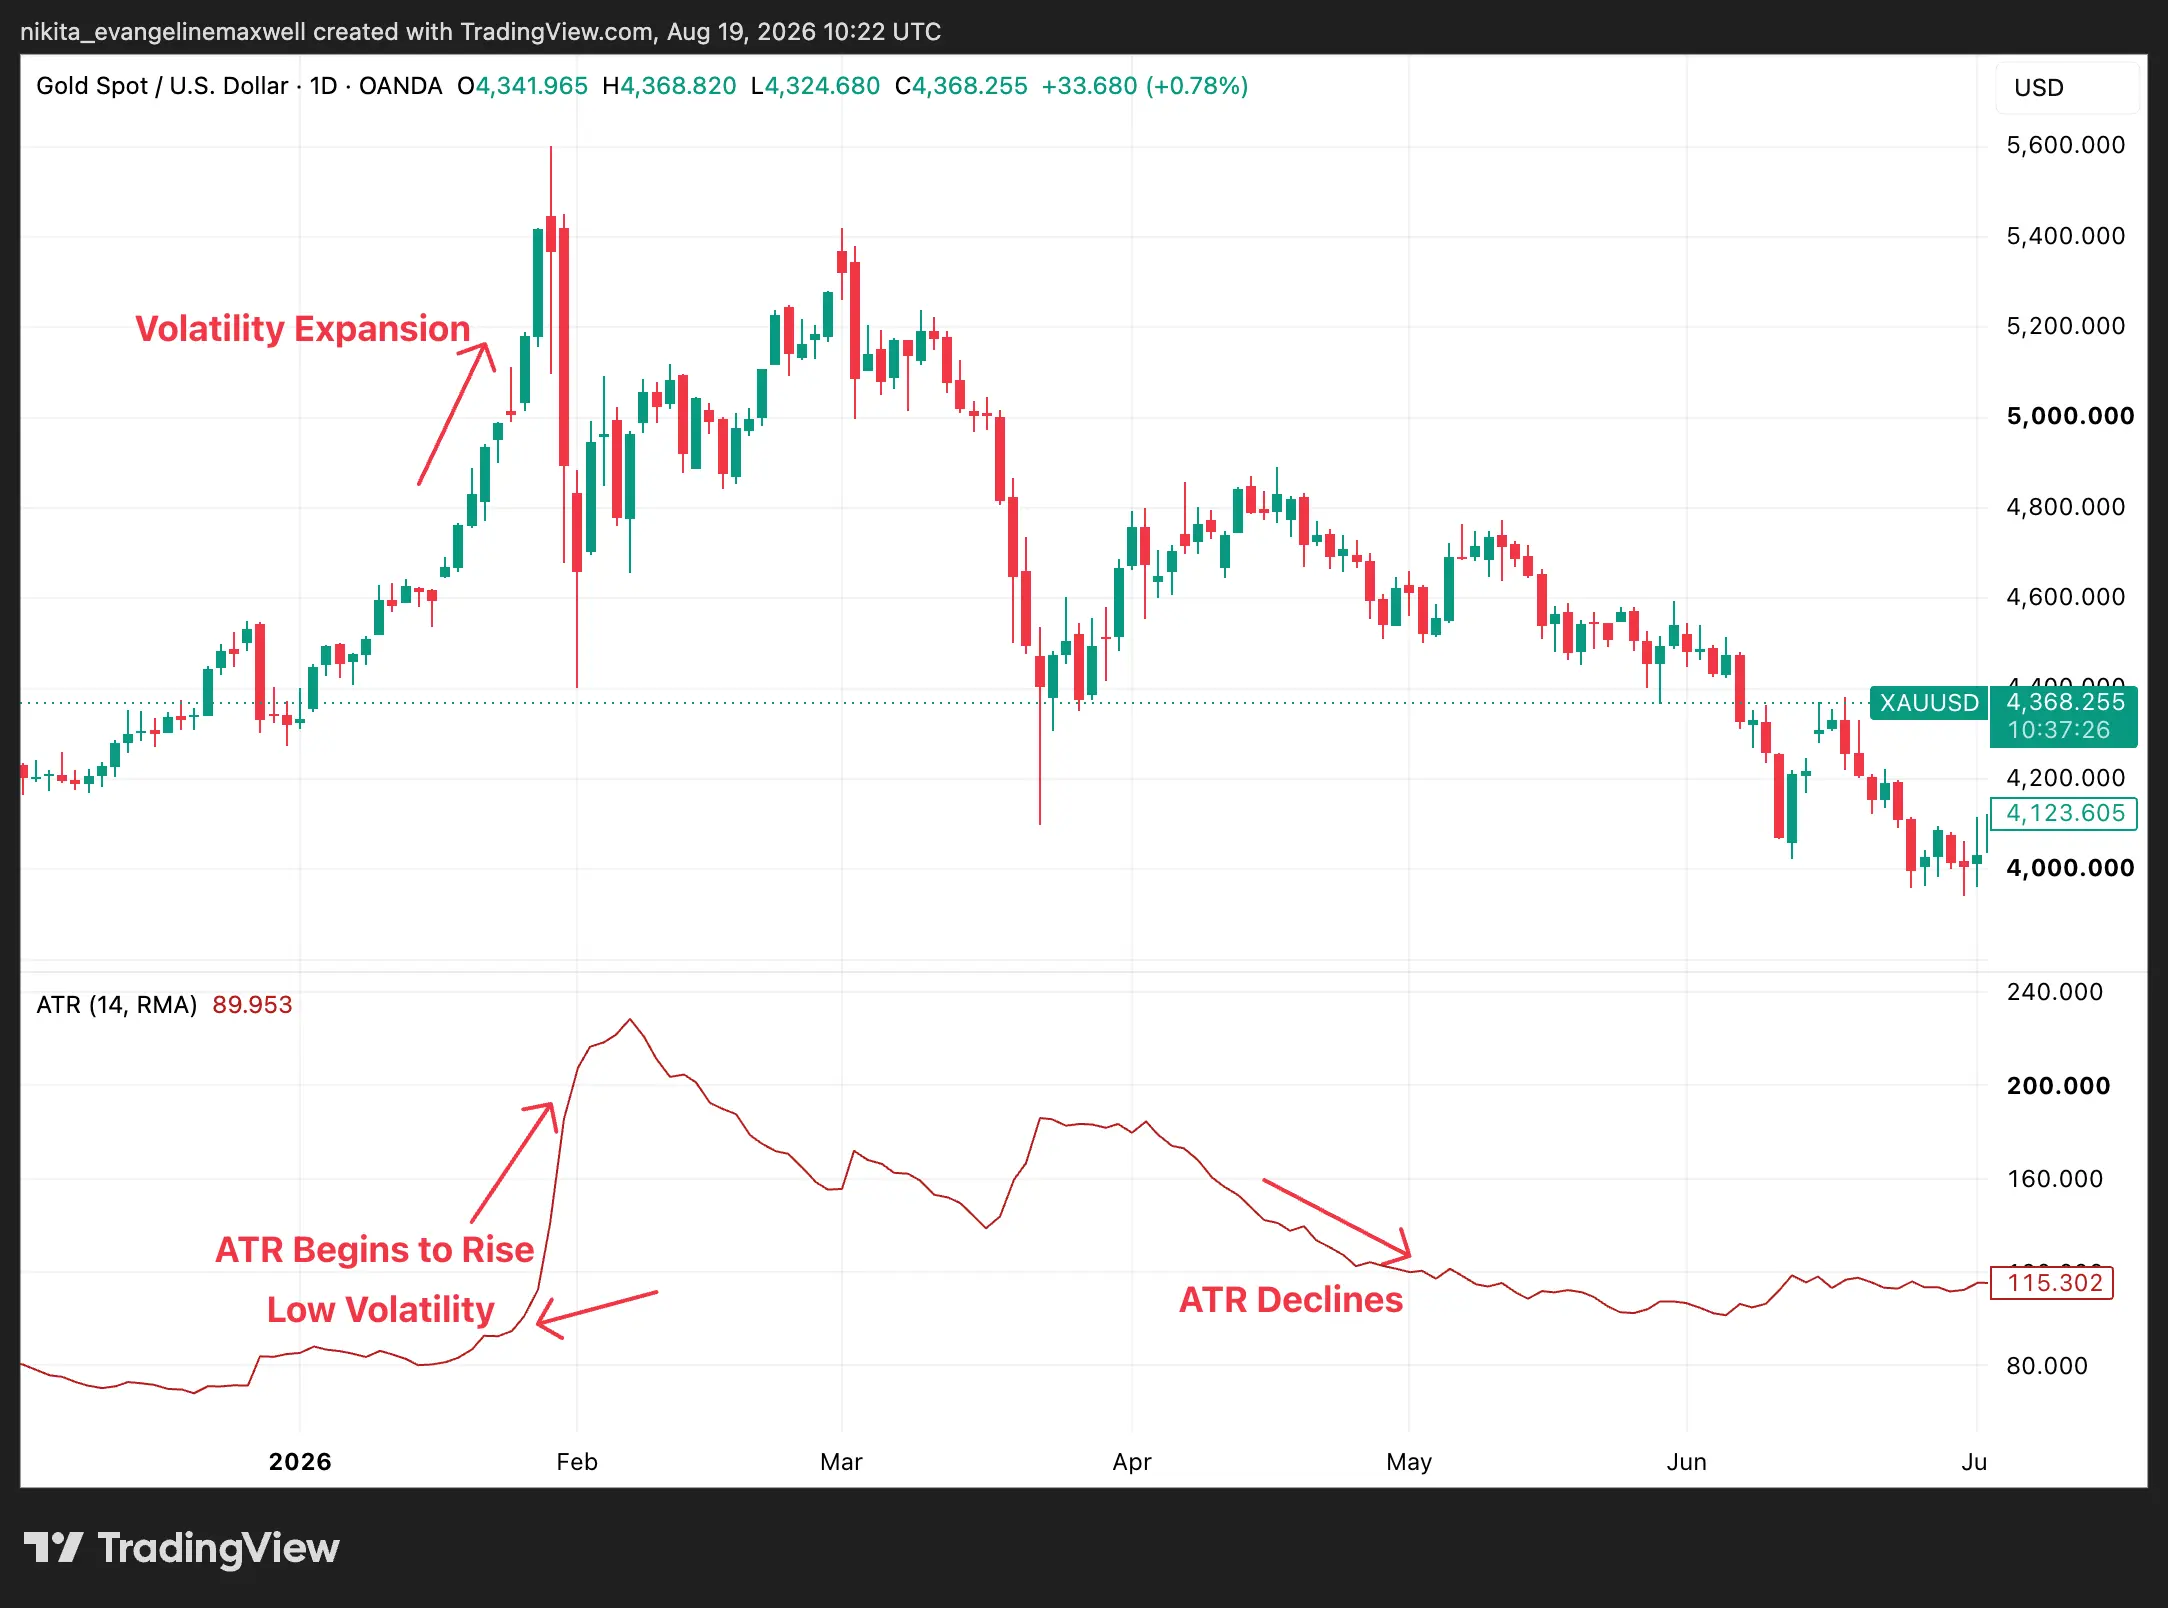
The chart shows relatively low ATR during January before a sharp rise as gold’s daily price ranges expand around early February. ATR remains elevated through February and March as wider daily movements continue, before gradually declining from April as volatility begins to ease.
The example shows how ATR can help traders compare the current pace of the market with its recent behaviour. It does not suggest that rising ATR confirms a continuing trend or that falling ATR predicts a breakout.
Limitations of ATR
ATR is based on historical price information and responds after volatility changes. It cannot predict an unexpected event or show how long a volatile period will continue.
A rising ATR does not confirm that a trend will continue. A falling ATR does not guarantee that a breakout is approaching. Sudden news may also cause current conditions to differ significantly from the period used in the calculation.
Because ATR values vary between instruments and timeframes, they must always be interpreted in context. ATR should not be treated as a standalone buy or sell signal.
Bottom Line
Average True Range helps traders measure how much an instrument has typically moved over a selected period, providing a useful way to assess changes in market volatility. Rising ATR indicates that price movements are becoming larger, while falling ATR indicates that they are becoming smaller.
However, ATR does not show market direction or predict what price will do next. It is most useful when interpreted alongside price action, market structure and other forms of technical analysis rather than as a standalone trading signal.