














How to Read Bollinger Bands: Mean Reversion and Market Volatility


Prices in financial markets rarely move in a straight line. Instead, they move through periods of trending, consolidation and changing volatility. They can also move significantly away from their recent average before returning towards it, a tendency known as mean reversion.
Bollinger Bands provide traders with a visual way to assess these changing conditions by showing how far price has moved from its recent average and whether market volatility is contracting or expanding. This makes them useful for identifying periods of low volatility, stronger price movements and potential mean reversion.
What Are Bollinger Bands?
Bollinger Bands consist of three lines placed around price.
- The middle band is usually a 20-period simple moving average, or SMA. It shows the average closing price over the previous 20 periods.
- The upper and lower bands are normally placed two standard deviations above and below the moving average. Standard deviation measures how widely prices have been moving around their recent average.
When volatility rises, the distance between the bands generally increases. When volatility falls, the bands move closer together.
The 20-period average and two standard deviation settings are commonly used starting points rather than fixed rules. Different settings may be more suitable for different markets and timeframes.
Although standard deviation is used in the calculation, the bands should not be treated as guaranteed statistical boundaries. Financial market prices do not follow a perfect pattern. Instead, the bands show whether price is relatively high or low compared with its recent range.
Reading Different Market Conditions
Bollinger Bands can help traders identify three broad market conditions: volatility contraction, volatility expansion and potential mean reversion.
1. Volatility Contraction and the Bollinger Band Squeeze
A volatility contraction happens when the upper and lower bands move closer together. This is often called a Bollinger Band squeeze.
The narrowing bands show that recent price movements have become smaller. This may happen when the market is consolidating and neither buyers nor sellers have taken clear control.
A squeeze can be followed by a larger price move as volatility returns. However, it does not show when that move will begin or which direction price will take. Price may break higher, break lower or continue moving within the same range.
For this reason, traders may wait for additional evidence, such as a clear break of support or resistance or a candle closing outside the recent trading range. A squeeze is an indication of low volatility, not a signal to buy or sell by itself.
2. Volatility Expansion
When price begins moving more sharply, the Bollinger Bands usually widen. This is known as volatility expansion.
If price breaks out of a range while the bands begin widening, it may suggest that a stronger move is developing. However, no breakout is guaranteed to continue, and false breakouts can occur.
During a strong uptrend, price may repeatedly touch or remain close to the upper band. This is sometimes described as “walking the band”. During a downtrend, price may remain close to the lower band.
An upper band touch is not automatically a signal to sell, just as a lower band touch is not automatically a signal to buy. When a trend is strong, price can stay near an outer band for an extended period.
Band touches should therefore be viewed alongside the direction of the trend, recent support and resistance levels and the wider price structure.
3. Mean Reversion
Mean reversion describes a possible move back towards the recent average after price has moved away from it.
With Bollinger Bands, the middle SMA acts as the reference for that average. If price moves towards an outer band and then begins to lose momentum, traders may watch for a return towards the middle band.
For example, price may move close to the upper band during a rally before pulling back towards the SMA. Similarly, price may approach the lower band during a decline before recovering towards the average.
A move towards the SMA is not guaranteed. Strong trends may continue for longer than expected, and price can move beyond an outer band without immediately reversing. Mean reversion is therefore a tendency rather than a rule.
Bollinger Bands in Practice
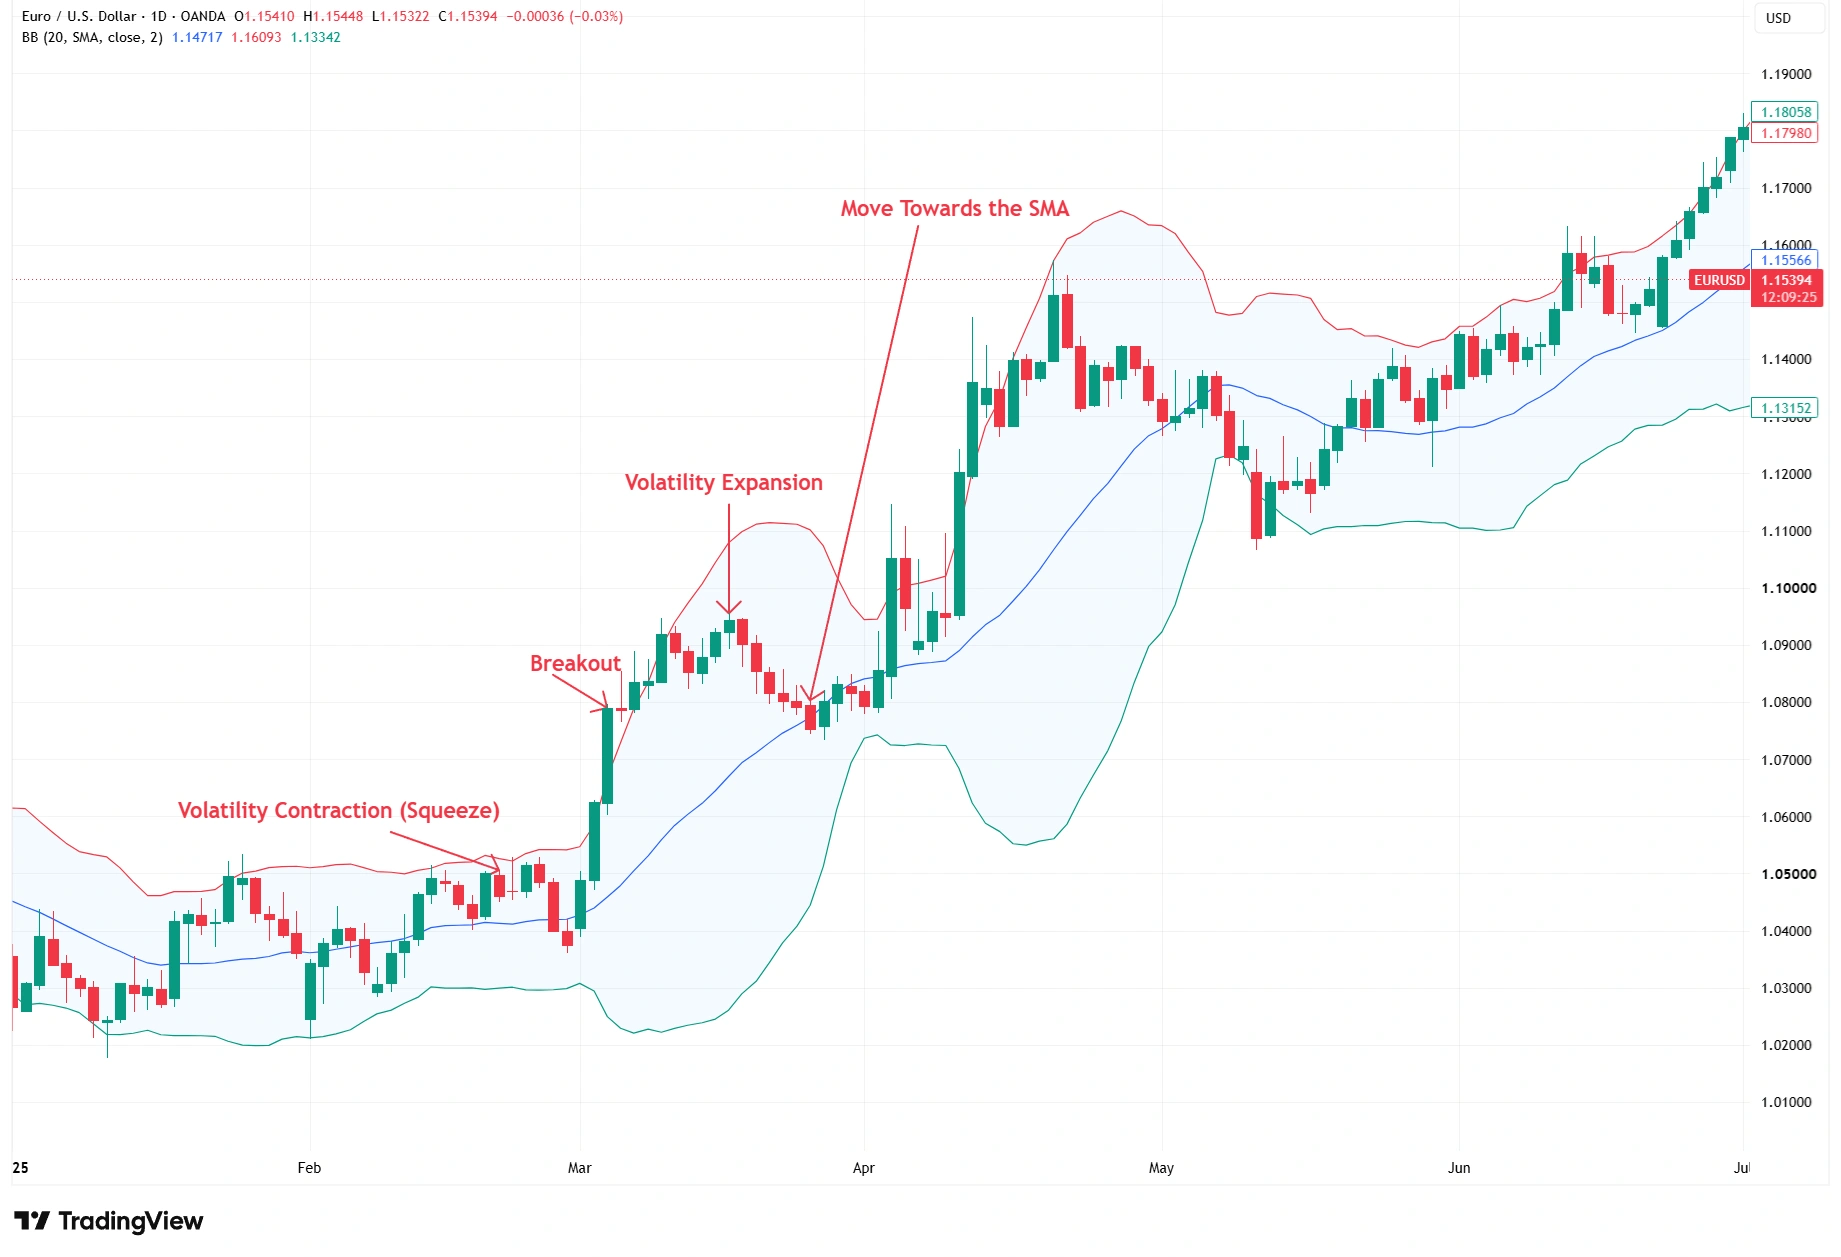
The chart below illustrates volatility contraction before an upward breakout in early March, followed by expanding bands and a later move back towards the 20-day simple moving average.
EUR/USD daily chart with Bollinger Bands, January to June 2025
Source: TradingView. Past performance is not a reliable indicator of future performance. Data accurate as of 12 August 2026.
The chart begins with a period of relatively narrow bands during January and February 2025. This shows that volatility had contracted.
At the beginning of March, EUR/USD moved above its recent trading range. The bands then began to widen as daily price movements became larger. Later in March, price pulled back towards the middle SMA, showing how price can return towards its recent average after moving away from it.
This example does not suggest that every squeeze will result in an upward breakout or that every price move will return to the SMA. It simply shows how Bollinger Bands can be used to follow changes in volatility and the position of price relative to its recent average.
Combining Bollinger Bands With Other Analysis
Bollinger Bands are generally more useful when combined with other forms of technical analysis.
Support and resistance levels can help show whether a band touch is taking place near an important price area. Trendlines and price structure can provide more information about the wider market direction. Momentum indicators, such as the Relative Strength Index, may also help show whether momentum is strengthening or weakening.
No form of confirmation can remove the possibility of a false signal. Markets can change direction unexpectedly, so risk management remains important.
Bottom Line
Bollinger Bands can help traders understand how volatility and price behaviour change across different market conditions. Narrowing bands can indicate volatility contraction, widening bands can reflect increasing volatility, while the middle moving average provides a useful reference point when assessing potential mean reversion.
However, Bollinger Bands should not be treated as standalone trading signals. Price can remain close to an outer band during strong trends, breakouts can fail and mean reversion is never guaranteed. Combining Bollinger Bands with price structure, support and resistance, trend analysis and momentum indicators can provide a more complete view of market conditions.
Like all technical indicators, Bollinger Bands are most useful as part of a broader technical analysis framework rather than as a tool for predicting future price movements in isolation.