














VWAP Explained: How Volume Changes the Meaning of Average Price


An ordinary average gives equal importance to every observation. Financial markets, however, do not record the same level of trading activity during every period. Some candles represent relatively little activity, while others contain considerably more volume.
Volume Weighted Average Price, commonly known as VWAP, accounts for this difference. It calculates an average price while giving greater influence to periods in which more trading occurred.
VWAP can help traders observe whether the current price is above or below the session’s volume weighted average. However, it describes trading activity that has already occurred and does not predict the next price movement.
What Is VWAP?
VWAP stands for Volume Weighted Average Price. It represents the average price of an instrument over a selected period, weighted according to trading volume.
The indicator normally appears as a single line over the price chart. Periods with higher volume have more influence on the line, while periods with lower volume have less influence.
Session VWAP updates as new price and volume information becomes available during the trading day. It normally begins calculating at the session open and resets when the next session begins.
VWAP is mainly used on intraday charts. Institutional investors may also use it as a benchmark when assessing the average price achieved while executing an order.
How Is VWAP Calculated?
The calculation begins with the typical price of each candle:
Typical price = (High + Low + Close) ÷ 3
The typical price is then multiplied by the volume recorded during that candle. These values are added together from the beginning of the session.
VWAP is calculated as:
VWAP = Cumulative (typical price × volume) ÷ cumulative volume
Each new candle contributes further price and volume information. This makes VWAP cumulative rather than based on a fixed rolling number of candles.
Why Does VWAP Reset?
Session VWAP normally resets at the beginning of each new trading session. This prevents activity from earlier sessions from continuing to influence the current session’s average.
The reset distinguishes VWAP from a conventional moving average. A moving average normally uses a rolling number of candles, while session VWAP accumulates information from the current session open.
The exact definition of a session depends on the instrument, exchange, data provider and chart settings.
Session VWAP is generally used on intraday charts containing several candles within each session. Applying a session anchor to a daily chart would cause VWAP to reset on every candle, making the line of limited practical use.
Reading Price Relative to VWAP
Price Above VWAP
When price is above VWAP, the latest market price is higher than the session’s volume weighted average up to that point.
This may accompany stronger upward intraday movement. However, it does not guarantee that price will continue rising. Movement above VWAP should not be treated as an automatic buy signal.
Price Below VWAP
When price is below VWAP, the latest market price is lower than the session’s volume weighted average.
This may accompany stronger downward intraday movement. It does not guarantee further declines or create an automatic sell signal.
Price Crossing VWAP Repeatedly
Price may move backwards and forwards across VWAP when the market lacks a consistent intraday direction.
Repeated crossings can produce misleading indications if every movement through the line is treated as an entry or exit signal. Price action and wider market structure are needed to understand the context.
VWAP in Practice
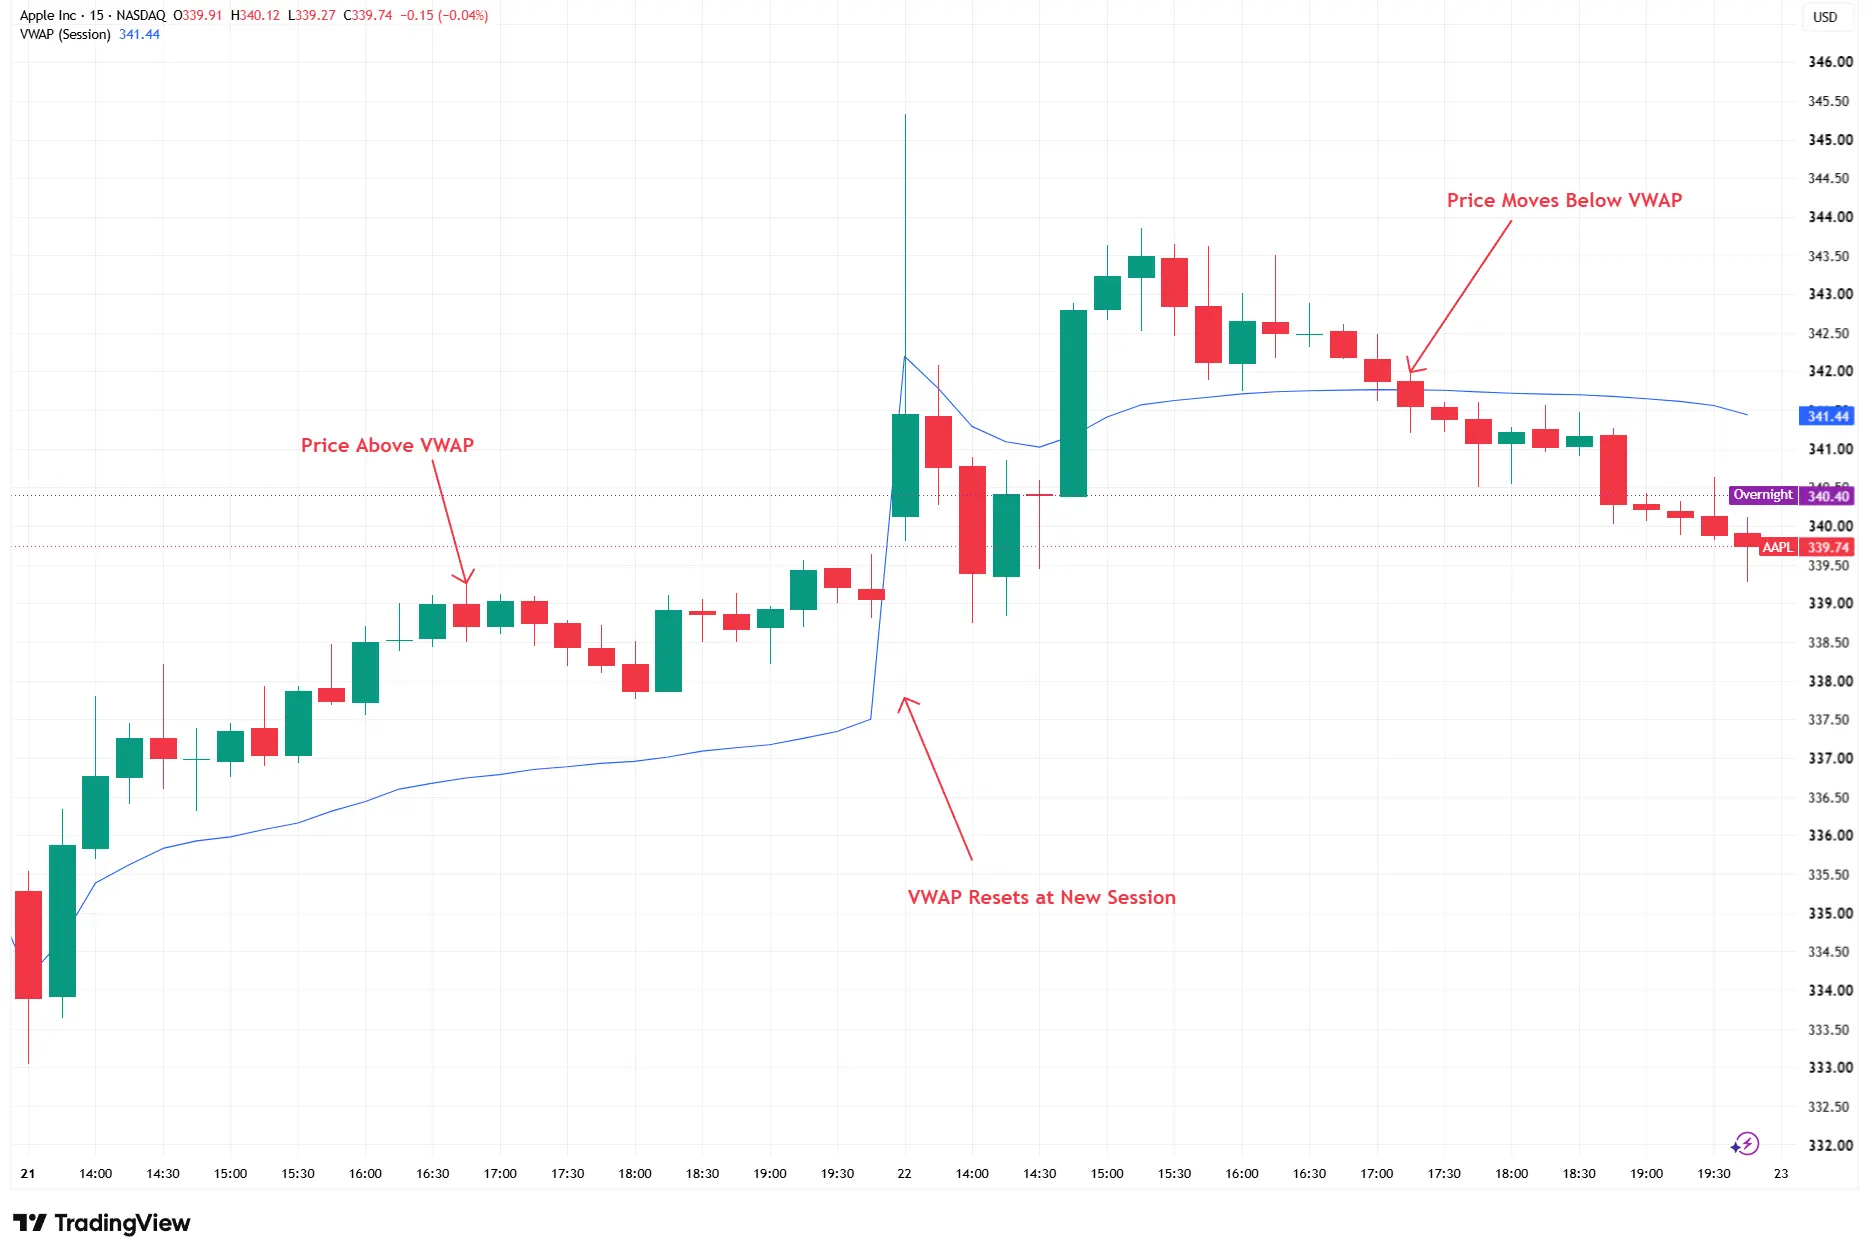
Apple 15-minute chart with session VWAP, 21 to 22 September 2026
Source: TradingView. Past performance is not a reliable indicator of future performance. Data accurate as of 23 September 2026.
The chart shows Apple trading above and below its session VWAP across 21 and 22 September 2026. The VWAP line resets at the start of the new session on 22 September, before developing as new price and volume information is recorded.
During the session on 21 September, Apple initially moves higher and then remains above the blue VWAP line for much of the period shown. This means the market price is above the volume weighted average calculated from activity earlier in that session.
At the beginning of the 22 September session, the blue line resets and begins a new calculation using the new session’s price and volume data. The sharp change in the line does not represent a sudden change in the previous session’s average. It reflects the start of a separate calculation.
During 22 September, price initially moves above VWAP as the intraday advance develops. Price later weakens and crosses below the line at approximately 17:00 to 17:30 on the chart. It subsequently remains below VWAP for much of the rest of the session.
The example demonstrates how VWAP develops throughout a session and how the relationship between price and the line can change. It does not suggest that VWAP predicted either the upward or downward price movement.
Limitations of VWAP
VWAP is based on historical price and volume information and may lag behind the current market.
The calculation can become slower to respond later in the session because it includes a growing amount of cumulative data. Sudden news may also move price sharply away from the line.
Price above VWAP does not guarantee further gains, while price below VWAP does not guarantee further declines. A crossover does not create an automatic entry or exit signal.
VWAP should not be treated as exact fair value or as a guaranteed support or resistance level. Its readings also depend on session definitions and the quality and scope of the available volume data.
Traders may consider VWAP alongside price action, support and resistance, market structure, the session high and low, volume and relevant company or economic events. Combining these tools does not remove the possibility of false signals or unexpected market movements.
Bottom Line
VWAP combines price and trading volume to calculate the session’s volume weighted average price. Periods with greater volume have more influence on the calculation. Price above or below VWAP can provide context about intraday movement, but it does not predict what happens next. VWAP is most useful as a description of the session’s developing trading activity rather than as a standalone trading signal.