













Technical Indicators Explained: RSI, MACD & Moving Averages
Trading based only on the movements of price is just a game of luck – it invites emotions into the decision-making process when what is really needed is objective evidence. Rather than looking solely at price, technical indicators give traders valuable insights into price behaviour, such as trend, momentum and clearer trading signals for when to act. This article covers some of the best trading indicators traders typically use to make sense of price action, including Moving Averages, RSI and MACD. It also explores what it means to look for confluence – agreement across multiple chart indicators – to support stronger trading decisions.
What are Technical Indicators?
Technical indicators give traders a better idea of an asset’s trend and momentum by turning raw price data into clear trading signals using mathematical calculations. Because they focus on past data, most technical indicators are ‘lagging tools’, which means they focus on showing what’s already happened in the market. They smooth out erratic price fluctuations to help identify recurring patterns and determine the statistical probability of price moving in a certain direction. Many inexperienced traders make the mistake of using technical indicators to try and predict the future, instead of using them as tools that filter out market noise.
What is a Moving Average?
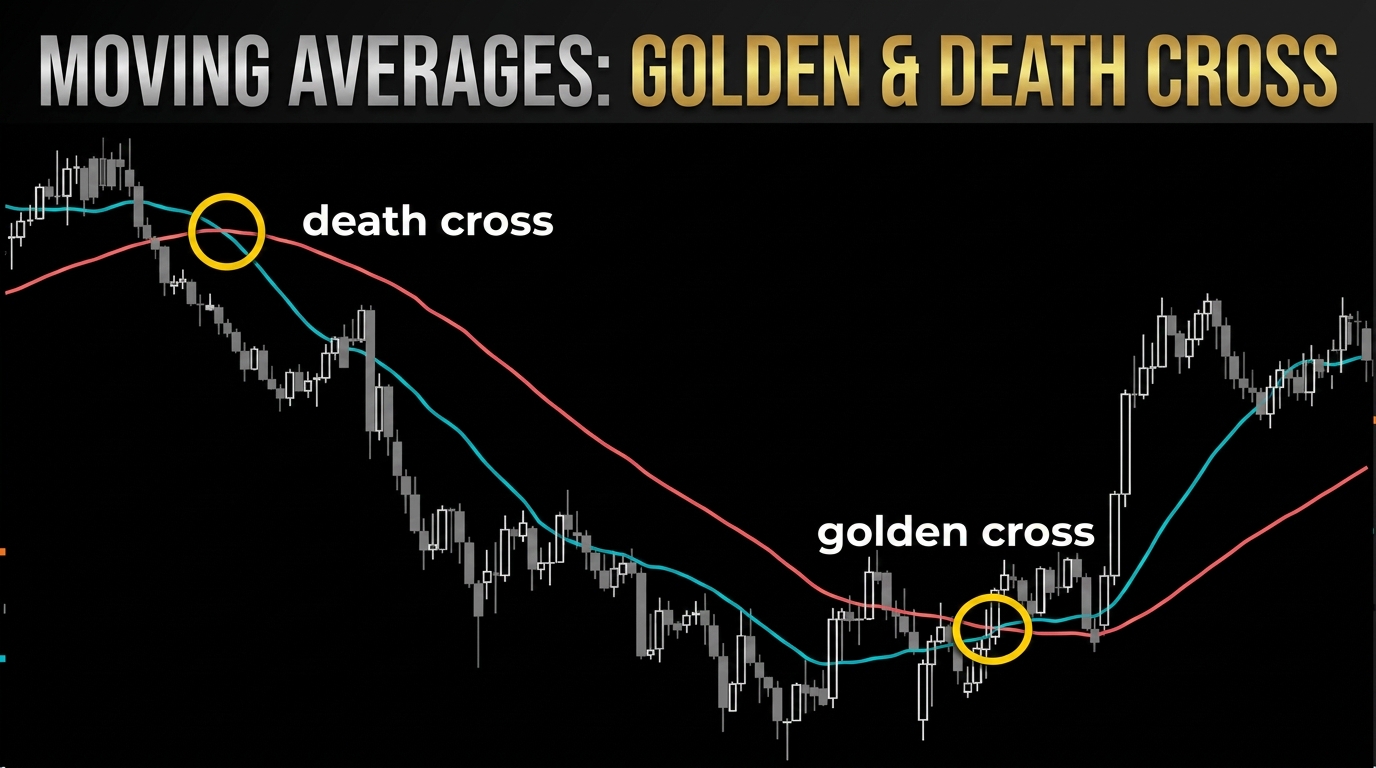
Moving Averages (MA) are a popular tool among traders, used to identify market trend direction. MAs are among the best trading indicators when it comes to making trends easy to see because they smooth out short-term and random price fluctuations. A moving average calculates the average price over a certain timeframe, but depending on the type of moving average, the average is calculated slightly differently. Here are two commonly used moving averages:
- Simple Moving Average (SMA): Straightforward calculations of average price over a period – a stable long-term anchor.
- Exponential Moving Average (EMA): Calculates average price over a period, giving more weight to recent prices, making it more reactive to new information.
Two things to keep an eye out for:
- Whether or not price stays above a rising moving average. If it does, it tends to mean that the market is in an uptrend, and if price holds below a falling one, then the market is in a downtrend.
- Crossovers between a shorter-term moving average (e.g. 50-day MA) and a longer-term moving average (e.g. 200-day MA) can hint at a potential shift in the trend's direction.
What is RSI?
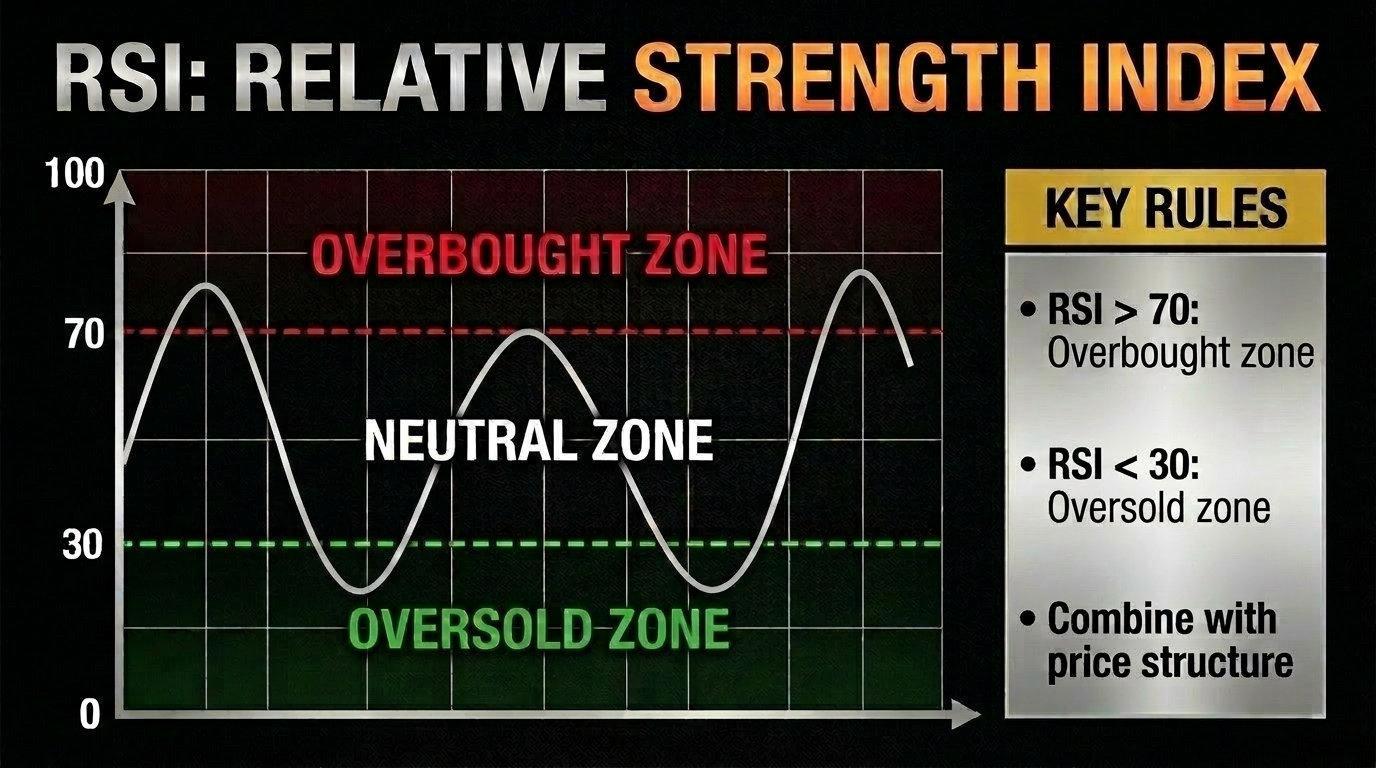
Relative Strength Index (RSI) shows how overbought or oversold an asset on a scale of 0 to 100. A reading above 70 is typically considered to be ‘overbought’ and one below 30 is ‘oversold’. RSI is one of the best trading indicators for measuring measuring the size of price movements (magnitude) and how consistently price moves in one direction (speed).
- Overbought (RSI > 70): Price has risen too far and too fast, so a pullback might be coming.
- Oversold (RSI < 30): Price has fallen too far and too fast, so a bounce might be coming.
Divergence is something traders tend to look for when analysing RSI. This is when price and RSI move in different directions in the same period. RSI divergence can act as early trading signals (not guarantees) that the current trend is fading and may be about to reverse. There are two types of divergence:
- Bullish Divergence: Price is making lower lows (falling), but RSI is making higher lows (rising). This signals a weakening downward momentum.
- Bearish Divergence: Price is making higher highs (rising), but RSI is making lower highs (falling). This signals a weakening upward momentum.
What is MACD?
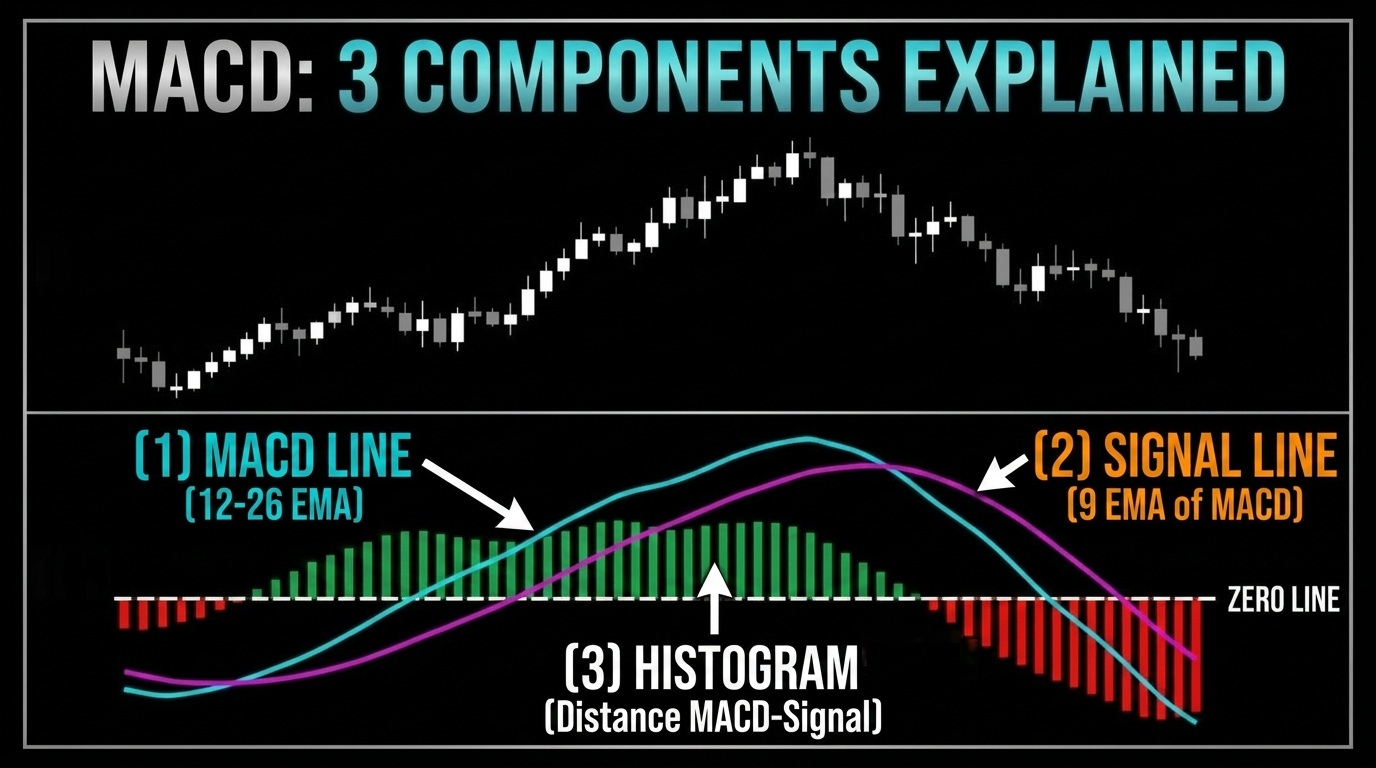
The Moving Average Convergence Divergence (MACD) is for identifying potential entry and exit signals, gauging momentum strength and spotting divergence (like with RSI). MACD consists of two lines and a histogram, all plotted on the same panel around a central zero line, tracking the momentum and direction of a trend.
- MACD line is the difference between two EMAs: the 12-period Exponential Moving Average (EMA) minus the 26-period EMA.
- Signal line is a moving average of the MACD line (9 periods).
- Histogram has bars showing the gap between the MACD and the signal line.
Two key things to look out for:
- Where the lines sit in relation to the horizontal ‘zero line’. If the lines are above zero, it means the market is bullish, and if they are below zero, it means the market is bearish.
- Crossover of the MACD line and signal line can indicate that momentum is accelerating in a specific direction, which could be a trading signal to buy or sell. However, not every crossover is a valid signal, especially if it doesn't point in the same direction as the broader trend.
Confluence: Combining Technical Indicators
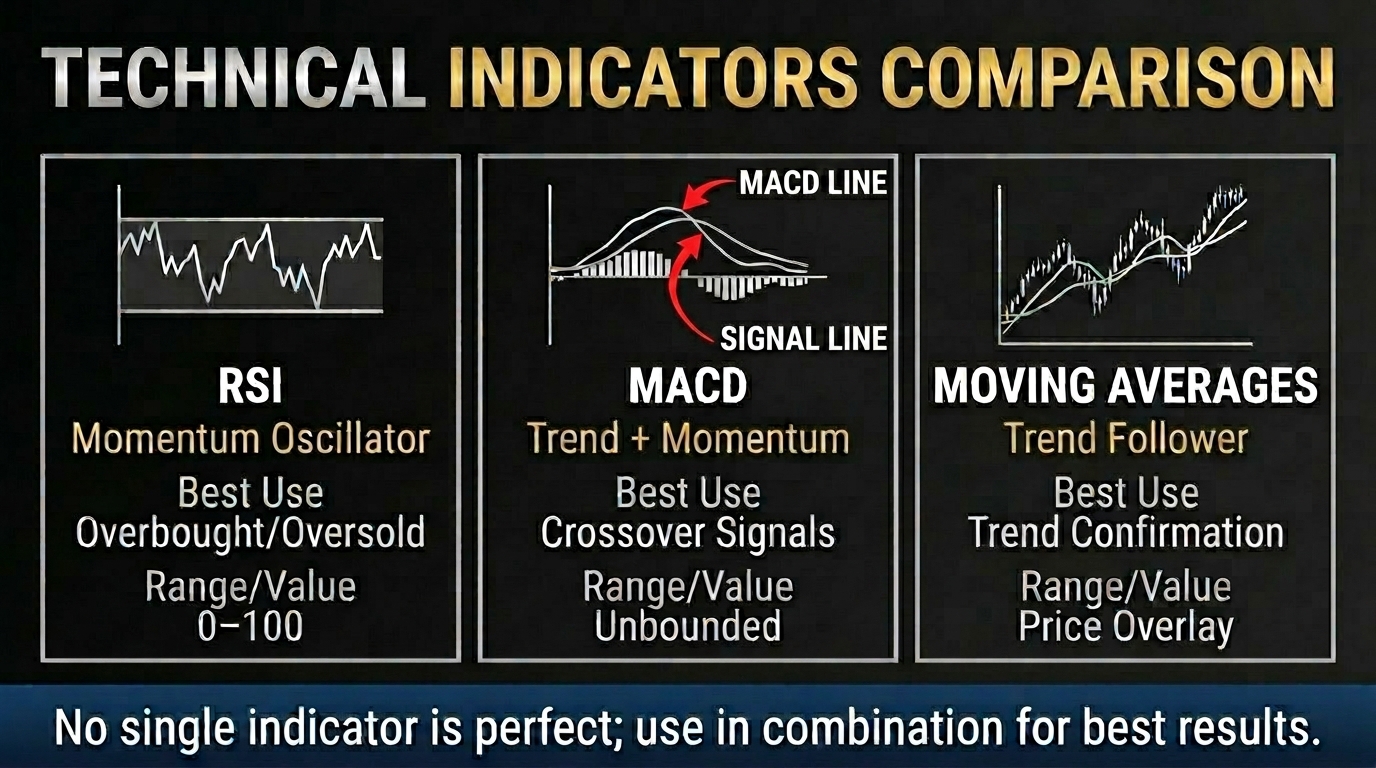
Many wonder 'what are the best trading indicators to use in technical analysis?', but in reality, there is no single "best" indicator. Relying on one technical indicator alone leaves too much uncertainty and is not enough to confirm a trading signal. When it comes to using them, confluence is key. That means ensuring that multiple chart indicators are telling the same story before making a trading decision. Each technical indicator has its own strengths:
- Moving Averages for determining trends.
- RSI for measuring momentum.
- MACD for timing confirmation.
In addition, some chart indicators are more effective than others, depending on whether the market is trending or range-bound. For example, moving averages are more effective when a market is in an up- or downtrend, but at times, can produce false trading signals in ranges. On the other hand, the RSI tends to be a better tool to use in range-bound markets. Combining chart indicators rather than relying on a single trading signal forces traders to create a checklist, which reduces emotional guessing and ensures that trades are only placed when the evidence supports the trade.
Conclusion
No single technical indicator gives the full picture. Moving Averages point to the trend, the RSI measures momentum and the MACD helps with timing, but each works best in different conditions and none produces a reliable trading signal on its own. The real value comes from confluence: waiting until several chart indicators agree before acting – the best trading indicators work together, not alone. Success depends on the discipline to stay sidelined when the signals clash, and the confidence to execute when the math aligns.
Note:
This content is for general information and educational purposes only and does not constitute investment advice or a personal recommendation. Any examples are for illustration only and should not be treated as a signal or invitation to trade. This material does not take into account your investment objectives, financial situation or needs. CFD trading is high-risk; losses may exceed deposits.