













Chart Patterns Explained: How to Spot and Trade Them
When traders analyse price charts to get an idea of trend and market structure, it is common to notice certain price movements that show up multiple times. These are known as chart patterns. Unlike candlestick patterns, which focus on short-term shifts in price (one to three candles), trading chart patterns is about looking at the broader trend and picking up hints on how the market may move next. This guide walks through the classics – head and shoulders, the triangle chart pattern and the flag pattern – and shows how each one sets up a breakout trade that can be planned with confidence.
Head and Shoulders Pattern
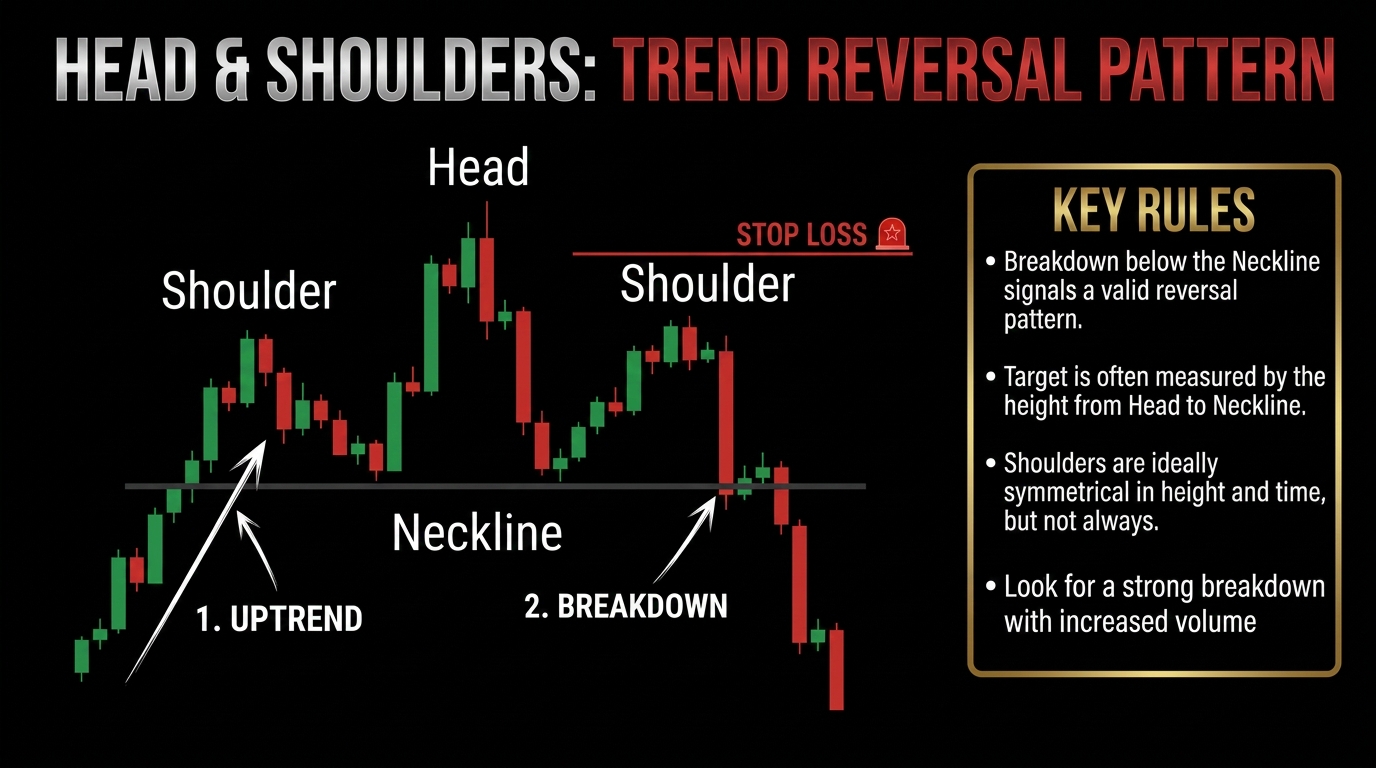
Head and shoulders patterns typically show up when an uptrend starts running out of fuel, where each rally makes less meaningful progress than the last and selling starts appearing earlier.
Formation: A head and shoulders pattern forms when price pushes up and pulls back, forming the left shoulder. Next, price pushes to one more high but is unable to follow through, so price pulls back, often deeper and sharper than earlier dips, forming the head. Then price attempts another rally, but is unable to reach the previous peak, forming the right shoulder. That last failure is what many traders read as a loss of buying conviction. The right shoulder acts as a natural invalidation point – a move back above it weakens the bearish case.
Trading head and shoulders patterns: The neckline can be drawn by connecting the two troughs on either side of the head, forming a support level. Experienced traders wait for a candle to close decisively below the neckline to confirm the pattern is complete before entering. To set a price target for a breakout trade, measure the distance from the head to the neckline and project that same distance downward from the breakout point.
Common mistake: Beginners often make the mistake of entering a breakout trade as soon as price breaches the neckline, only for price to snap back, known as a ‘fakeout’.
None of this guarantees the next move. The real benefit of the pattern is structure: a defined setup, a clear point of invalidation and a reason to trade beyond pure hope.
Triangle Chart Pattern
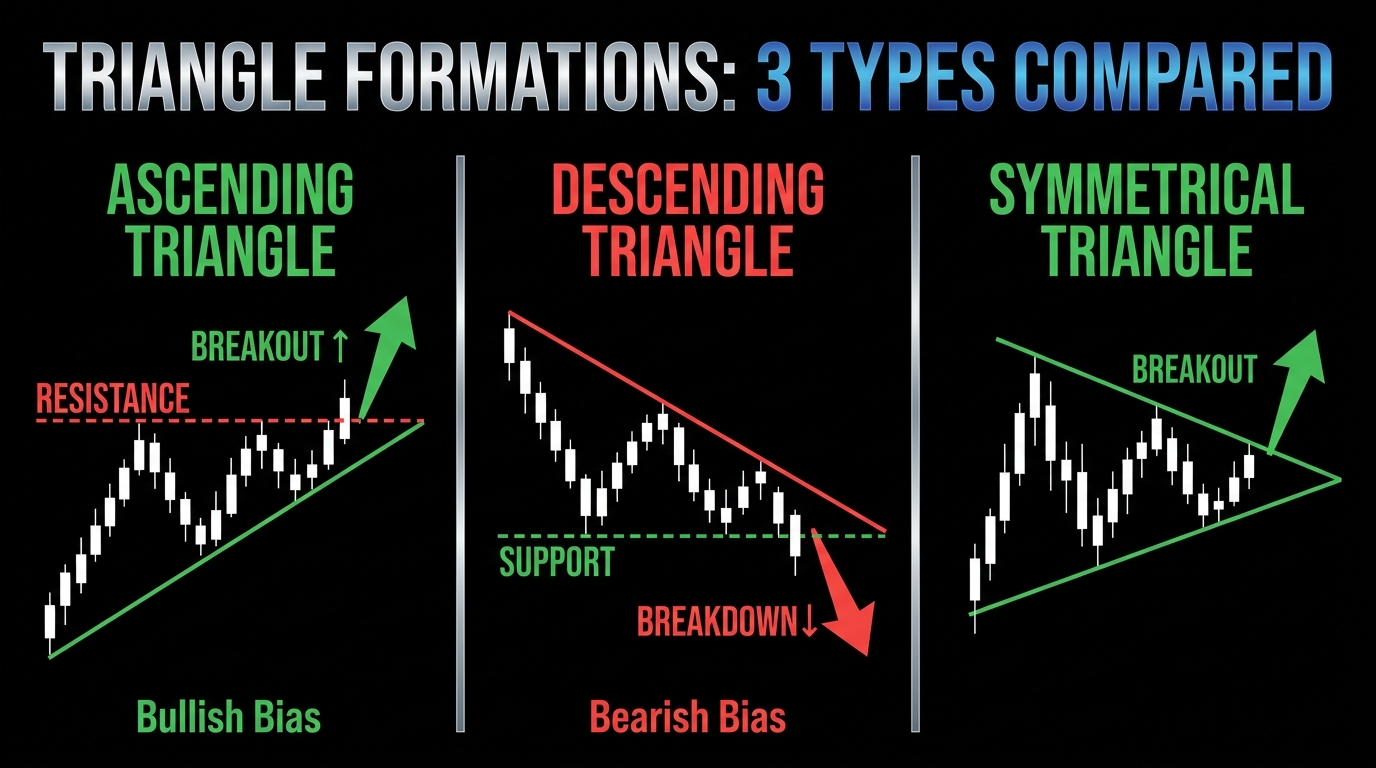
Triangle chart patterns are signals of potential continuation or reversal. They usually show up when the market is contracting, when swings get smaller, volatility drops and price gets pinned between two converging boundaries, creating a triangle shape on the chart. A triangle doesn't signal direction, but it does mark a point where a breakout, when it comes, is likely to move quickly. There are three types of triangle chart patterns:
- Ascending Triangle: Repeated tests of the same resistance level (ceiling), with higher lows underneath.
- Descending Triangle: Repeated tests of the same support level (floor), with lower highs above.
- Symmetrical Triangle: Both sides compress, lower highs and higher lows, until one side gives way.
Formation: Triangle chart patterns typically form after a large price movement when buyers and sellers reach a temporary standoff, with no side having enough conviction to start a new trend. This causes the price range to get smaller and smaller, creating the triangle shape on the chart. Triangle chart patterns work like a coiled spring; the longer price stays compressed, the more energy builds behind the move – price cannot stay contained indefinitely.
Trading triangle chart patterns: A candle closing convincingly outside the triangle lines is the signal to enter a breakout trade. That close is confirmation that the market has committed to a direction, not just tested the boundary. For a target, measure the height of the triangle at its widest point and project that same distance from the breakout point. If price moves back inside the triangle after a breakout, the setup is invalidated and the position should be closed.
Common mistake: Inexperienced traders commonly make the mistake of entering too early simply because they see a triangle drawn on the chart. However, direction should never be assumed before the market breaks.
Flag Patterns
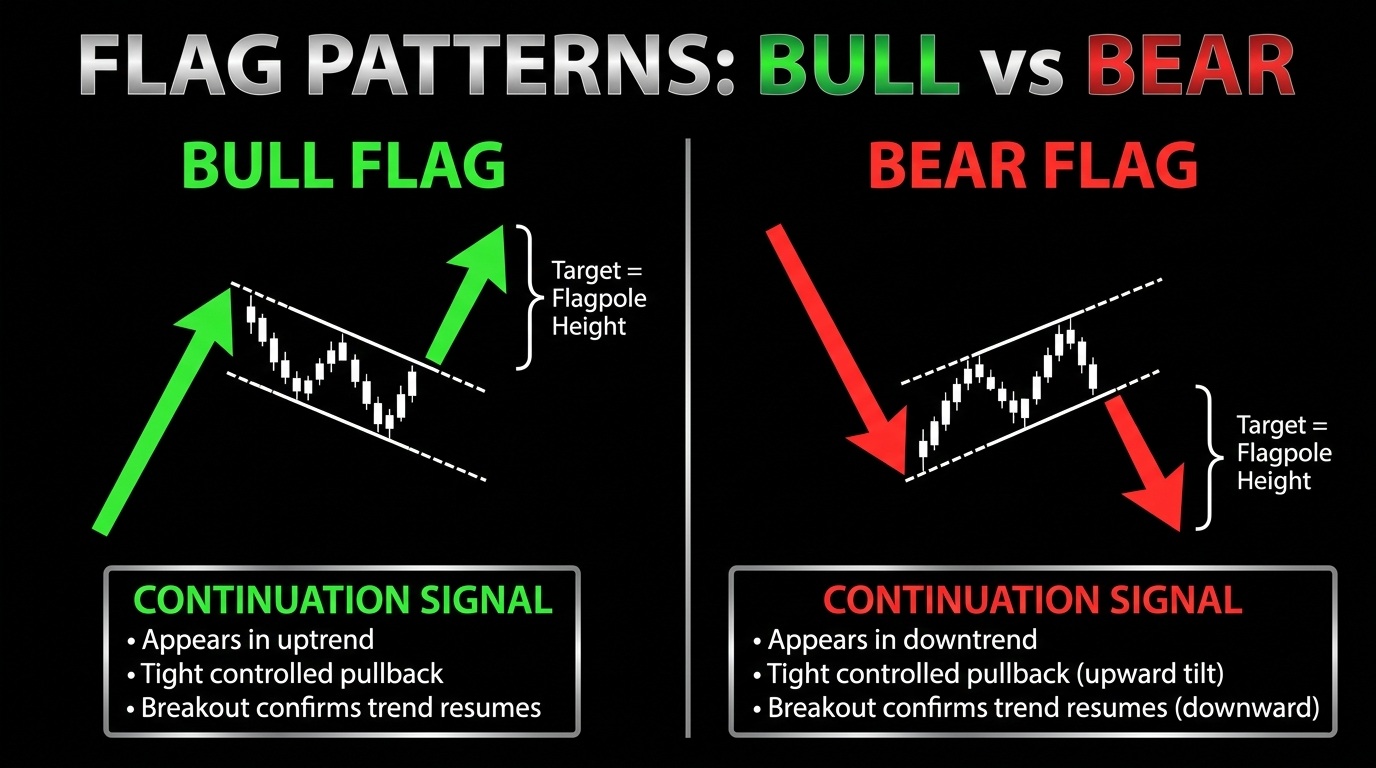
A flag pattern is a tight and controlled pause that happens after a strong, sharp price move. Markets rarely push strongly in one direction without a pause. The expectation is that once the market has settled, the original trend picks back up and continues in the same direction. There are two types of flag patterns:
- Bull Flags form as a sharp push up (the ‘flagpole’), then a tight, controlled pullback that slopes slightly downward.
- Bear Flags are the exact opposite – a sharp drop, then a slow retracement higher inside a narrow channel.
Trading flag patterns: Wait for a clean break and close outside the flag boundary in the direction of the prior move before entering. Determine a take-profit target for the breakout trade by measuring the height of the flagpole and projecting that distance from the breakout point. The trade is invalidated if price closes back inside the flag.
Failed flag: Flag patterns must stay tight and controlled, so if the pullback (in a bull flag) or bounce (in a bear flag) retraces more than half of the initial move, the flag is no longer valid. If this happens, the market is no longer just ‘taking a rest’ and is likely entering a reversal or a messy range.
Strategy for Trading Chart Patterns
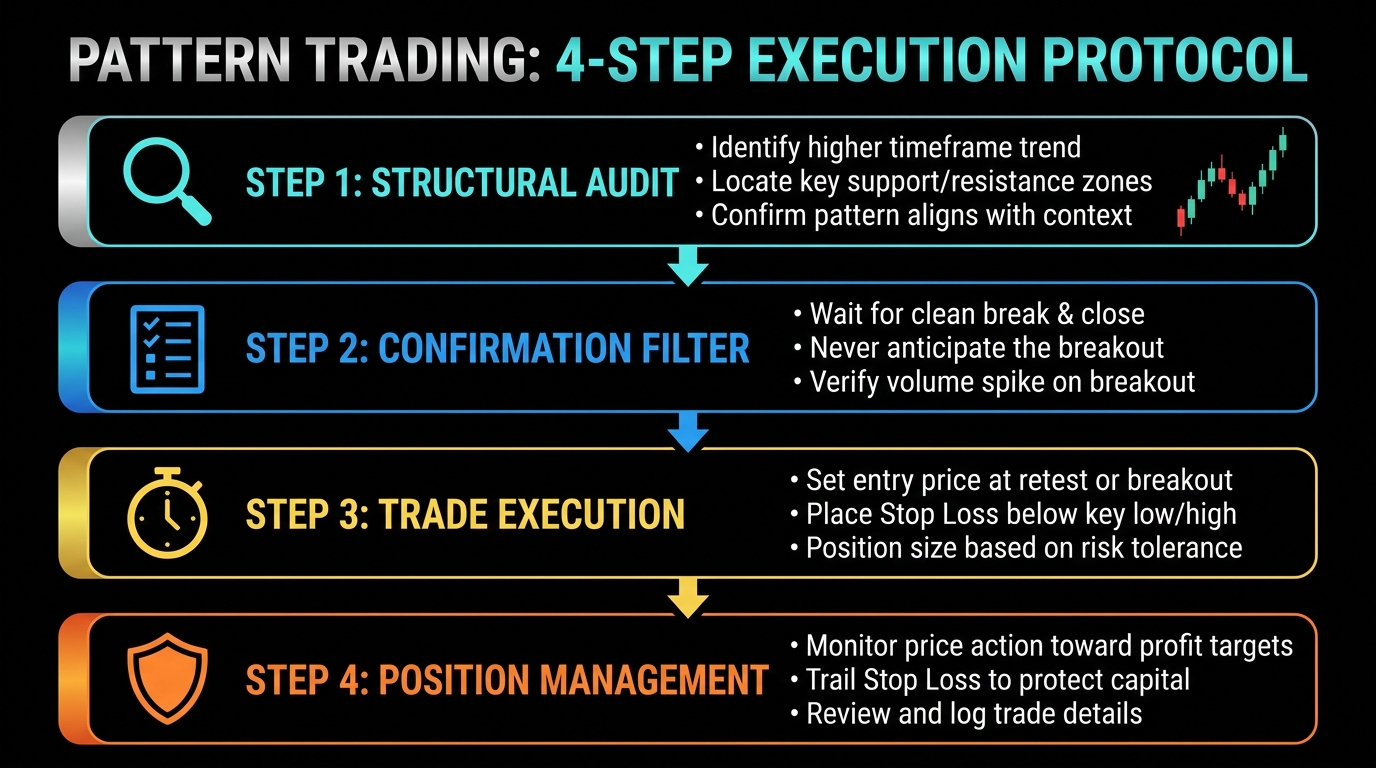
While spotting patterns on a price chart is a handy skill, it is only half the job. The next half is knowing how to capitalise on them, and that requires a structured framework. These four steps turn trading chart patterns into a disciplined process, with a clear plan for entry, risk and target on every setup:
- Start with context
Before labelling anything a triangle chart pattern or flag, zoom out. What is the higher-timeframe trend doing? Where are the major support and resistance zones? Trading chart patterns against the dominant daily trend typically requires stronger confirmation and tighter risk control. - Wait for confirmation of the pattern
Most losses from trading chart patterns come from anticipating the break rather than waiting for it. Always wait for confirmation, which is commonly identified as a clean close beyond the key boundary.- For head and shoulders, that means a close below the neckline.
- For flags, a close outside the consolidation channel.
- For head and shoulders, that means a close below the neckline.
- Define the pattern’s point of invalidation
A stop-loss defines where the idea is wrong, not just where the pain threshold is. If price returns to and holds where it shouldn't, the setup has failed and the position should be closed.- In a head and shoulders pattern, the right shoulder is the common invalidation area.
- In a flag pattern, invalidation is the opposite side of the structure – the lower boundary for a bull flag, the upper boundary for a bear flag.
- In a head and shoulders pattern, the right shoulder is the common invalidation area.
- Set a consistent target
Setting targets before entering a breakout trade provides a consistent basis for planning reward relative to risk.- For head and shoulders, measure the distance from the head to the neckline and project it from the breakout point.
- For flags, measure the flagpole and project it from the breakout point.
- For head and shoulders, measure the distance from the head to the neckline and project it from the breakout point.
How Chart Patterns Behave in Different Markets
Chart patterns may look identical across all major markets and encompass the same underlying price behaviour, but the key difference between asset classes is the market conditions. These can have a great impact on how a pattern plays out and, therefore, the outcome of a trade. Let’s take a look at what traders should expect in the following three major markets:
Forex
Patterns are more continuous due to the 24/5 nature of the forex market, as opposed to the stock market where there are daily close-and-reopen gaps in price. This continuity also makes trendlines and consolidations easier to read, though it does not reduce risk, particularly for breakout trades placed around major macro releases when spreads and slippage can spike sharply.
Equities
When trading chart patterns in the equities market, it is important to account for scheduled event windows and changes in execution conditions from one session to the next. This is because stocks are not only heavily influenced by the closing bell, but also earnings reports, guidance updates and overnight headlines, which can create large gaps that skip past a key level entirely or invalidate a pattern before it completes.
Crypto
Patterns form frequently in the 24/7 crypto market, but due to the highly volatile nature of crypto, this market sees the highest number of false breakouts and the fastest reversals. This means there is a higher risk of a breakout trade failing here than in less volatile markets.
Bottom Line: Market context determines how reliable a pattern is. Recognising the shape is one part of the process – adjusting risk, position sizing and expectations to match the market's liquidity and event structure is what makes trading chart patterns workable across asset classes.
Conclusion
Trading chart patterns is less about predicting the future and more about following a structured process with discipline. Whether it is a triangle chart pattern or a flag pattern, and whether the market is forex or equities, the process stays the same: wait for confirmation, define the invalidation point and let the measured move set the target. Get the process right and every pattern becomes a repeatable setup rather than a one-off guess.
Note:
This content is for general information and educational purposes only and does not constitute investment advice or a personal recommendation. Any examples are for illustration only and should not be treated as a signal or invitation to trade. This material does not take into account your investment objectives, financial situation or needs. CFD trading is high-risk; losses may exceed deposits.