













How to Find Support and Resistance Levels
Knowing how to find support and resistance levels is key to reading any price chart. They tell traders whether buyers or sellers are in control and indicate where the balance between demand and supply is likely to shift. The first step to being able to identify these key levels is answering the most basic question ‘what is support and resistance in trading?’ It is important to understand what they are and why they exist in order to be able to spot them on a chart. From there, support and resistance trading becomes less about just guessing where price will go, and instead, more about how to use them to control risk and make calculated trading decisions.
What is Support and Resistance in Trading?
Everything in technical analysis builds on one foundation — 'what is support and resistance in trading?', which is the starting point for analysing any price chart. Support and resistance are the specific price zones at which the balance of power between buyers and sellers tends to shift – they are essentially the psychological boundaries of the market.
- Support (the floor) is the price zone at which demand overwhelms supply, preventing prices from dropping lower. This is where more and more buyers step in as the majority of traders believe the asset is undervalued.
- Resistance (the ceiling) is the price zone at which supply overwhelms demand, preventing prices from climbing higher. At this price, the majority of traders believe the asset is overvalued, so they start selling.
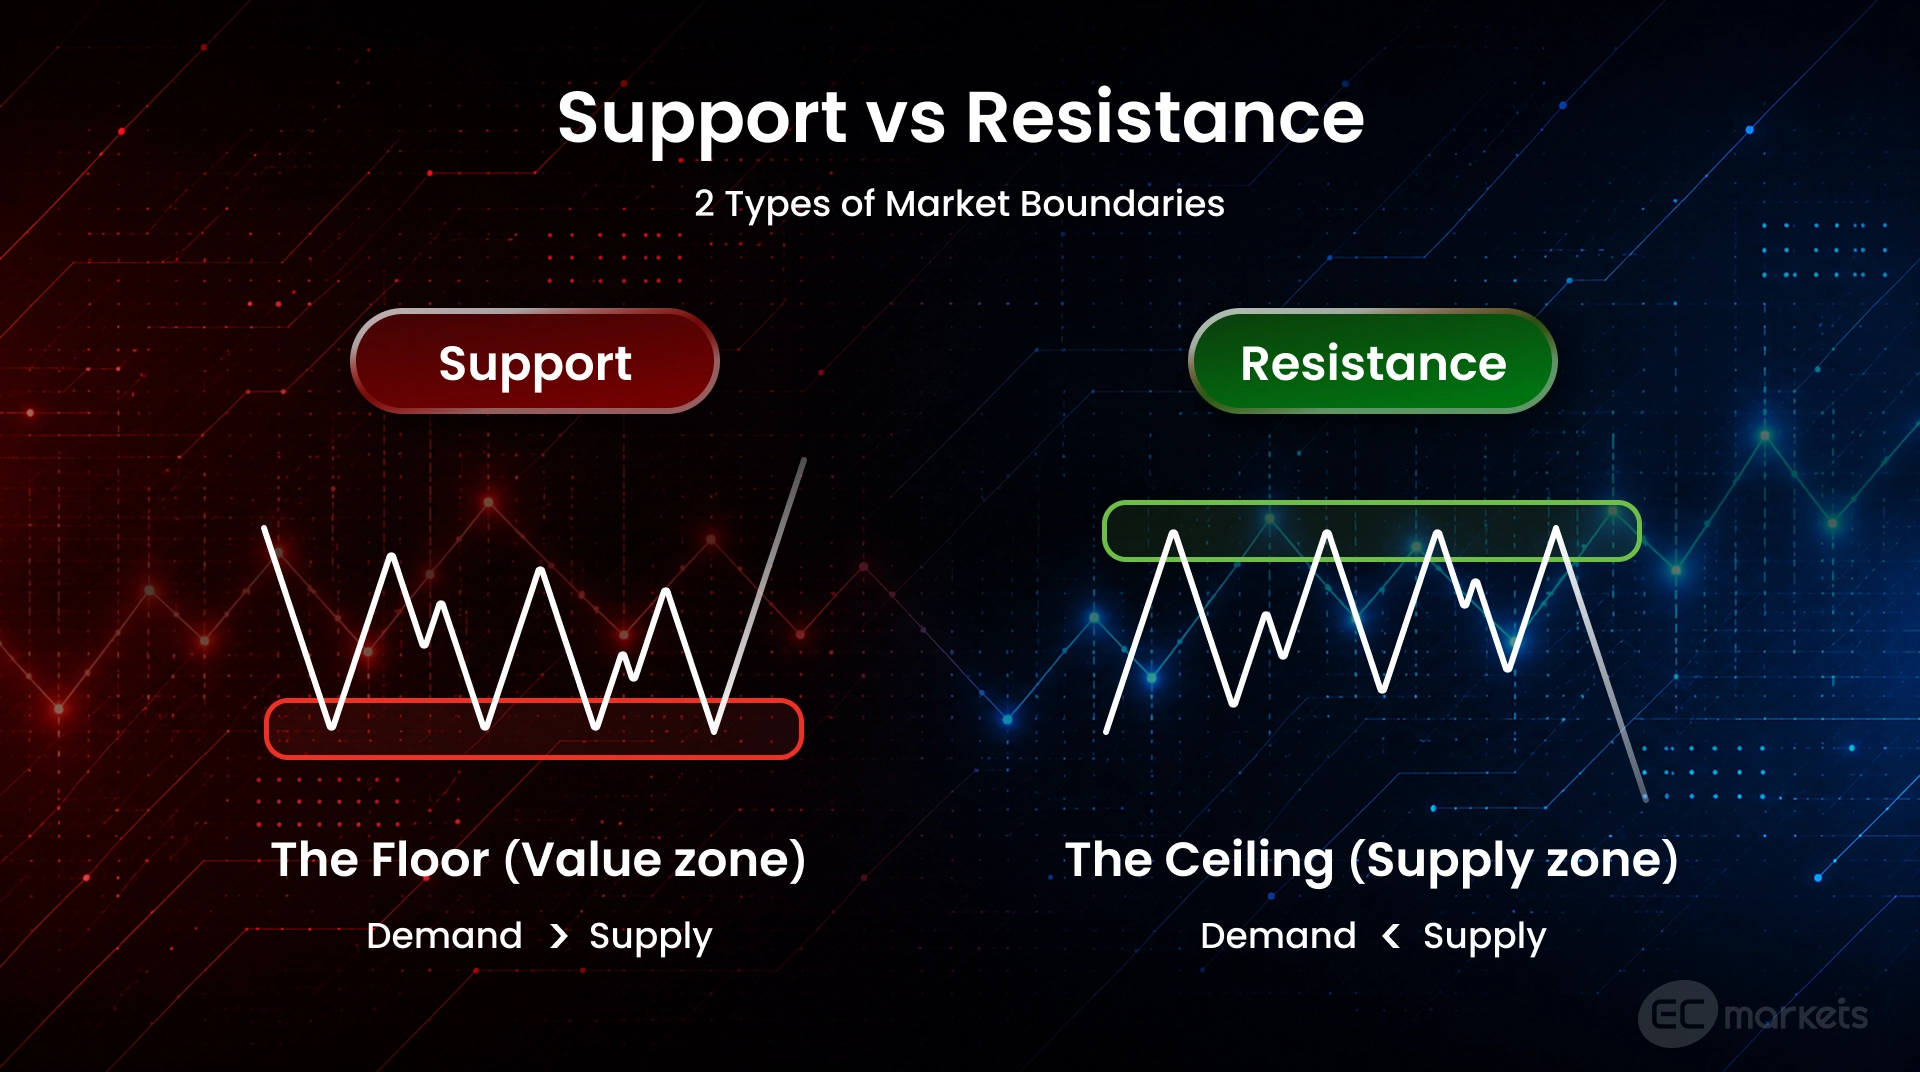
To fully answer 'what is support and resistance in trading?', it is important to know why these zones appear at all. Price tends to reverse at these particular key zones because people remember the places where the market has reacted before. Because they remember these price zones, they tend to place their orders there again, causing a cluster of orders at these zones.
- Support zones are where bid orders cluster. These are typically buyers trying to enter the market at a discount and short traders taking profit.
- Resistance zones are the same story in reverse – they are where ask orders cluster. These are sellers taking profit on their longs and short traders opening positions.
The reality of support and resistance trading is that price does not bounce off the exact same level every time, let alone bounce off it at all – it can often break through. That is why they should be treated as hints as to where the majority of market participants are likely to make a decision: will it reverse or break through? Knowing how to find support and resistance levels provides the structural map required to define risk and manage expectations – not to predict a bounce.
How to Find Support and Resistance Levels
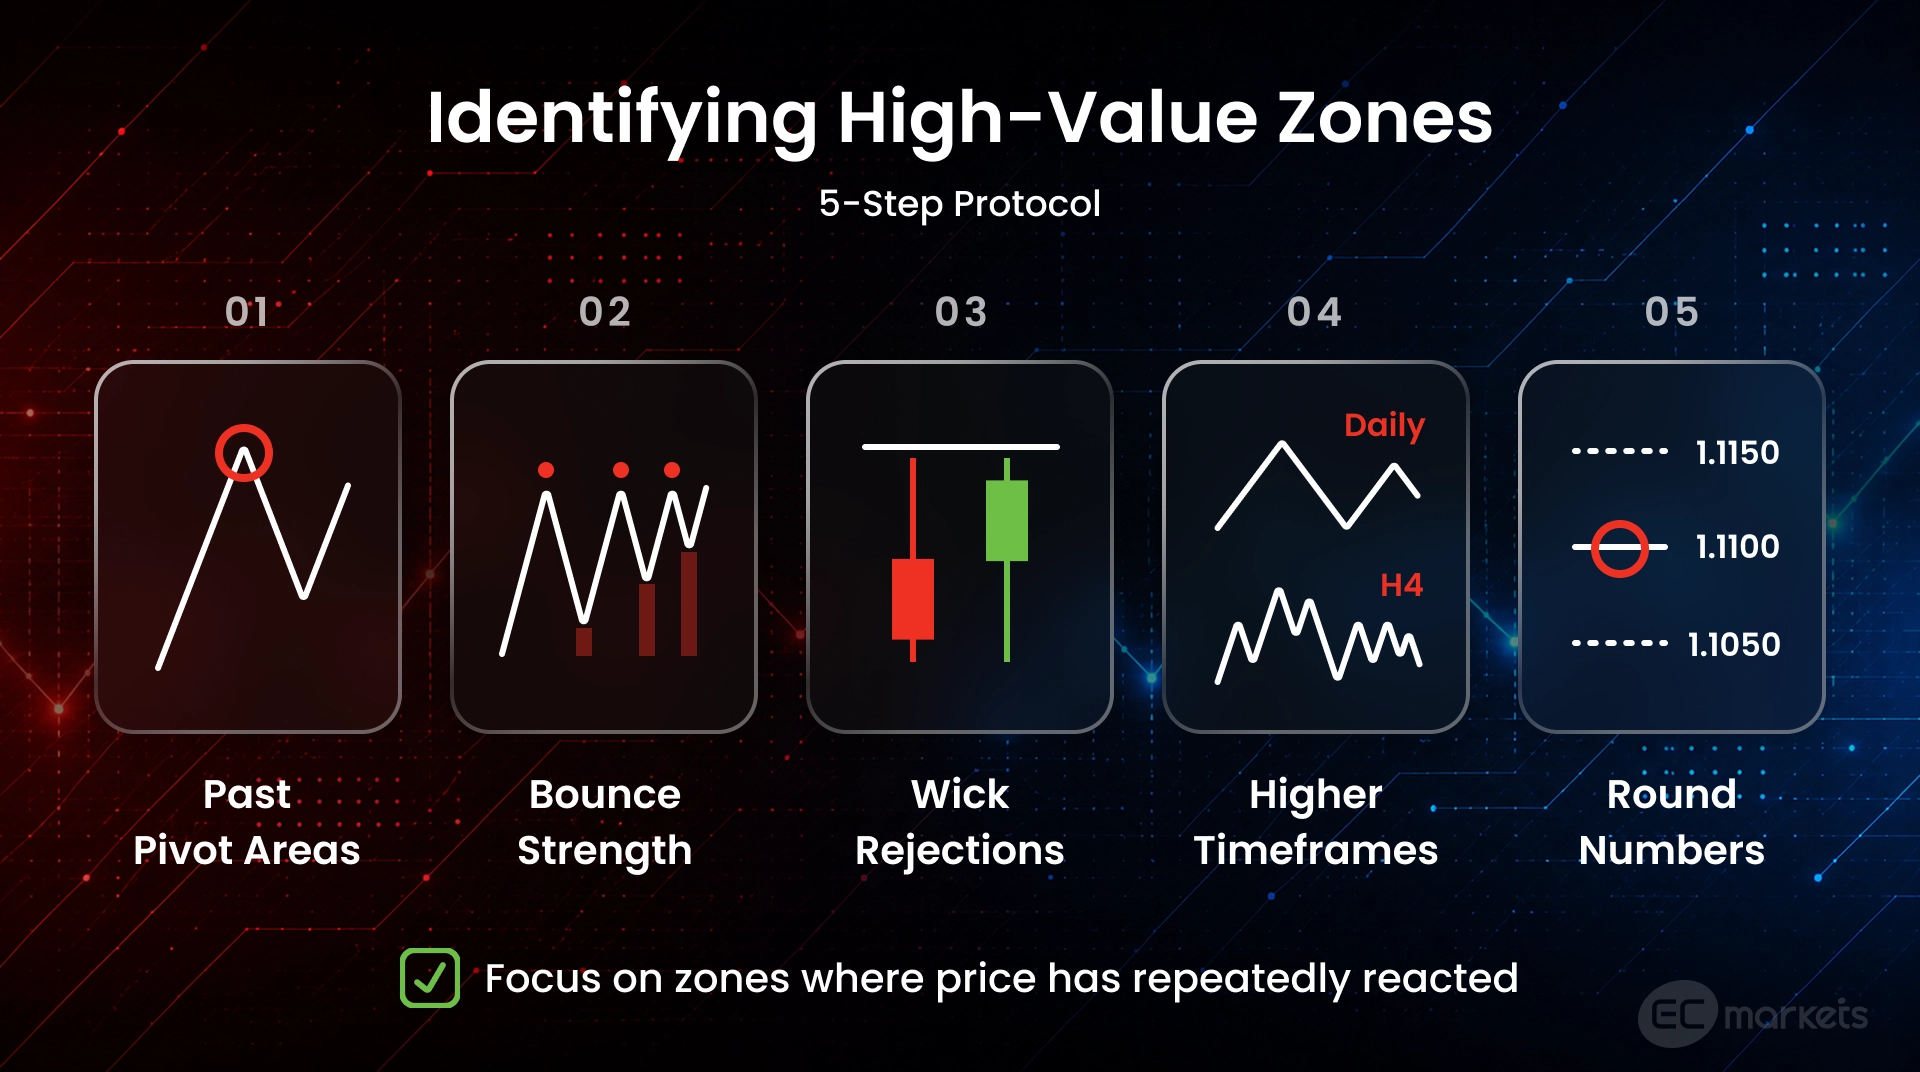
It is important for beginners learning how to find support and resistance levels to realise that it is about being able to identify areas where real buying and selling interest has historically built up — not pinpointing exact price levels. Understanding 'what is support and resistance in trading?' is step one. Step two is looking for confluence: multiple independent reasons that all point to the same level. Here is what experienced traders who know how to find support and resistance levels typically look out for:
- Past pivot areas.
Mark zones where price clearly turned, especially where a prior move was rejected fast. Orders tend to cluster around these areas because traders remember them as places that previously ‘worked’. - Bounce strength
If each bounce gets weaker, don’t expect the level to hold. Many traders believe that the more times a level is touched, the stronger it becomes. However, the opposite is often true — this is one of the most counterintuitive lessons when answering 'what is support and resistance in trading?' Think of a support or resistance zone as a pool of available orders. Every time the price hits that zone and bounces, it "consumes" some of those orders. If the price keeps returning to the same level and the bounces get smaller each time, it shows that the supply or demand is being absorbed. Once the orders at that level are completely used up, the level will break. - Long wicks
A long wick is proof of a rejection. It means price tried to punch through a level but got thrown straight back before the candle closed. The longer the wick, the stronger the rejection, which is evidence that the level is holding for now. - Where support and resistance sit on higher timeframes
A 5-minute support line can be noise. Start on the Daily or H4 to find the levels that actually control structure, then drop down to refine entries. The ideal support and resistance trading approach is to work top-down: use the higher timeframe to find the levels that matter, then drop to a smaller timeframe to refine entries, and when the two line up at the same price (confluence), that's where the strongest, cleanest setups appear. - Round numbers
Prices ending in ‘00’ or ‘50’ (known as ‘Big Figures’) act as psychological anchors for humans and institutional algorithms alike. Major banks often cluster their buy and sell orders at these clean, round numbers rather than at random prices. With so many orders stacked there, traders should expect sharper reactions and sudden bursts of volatility whenever price reaches one.
Tools to Help Identify Support and Resistance
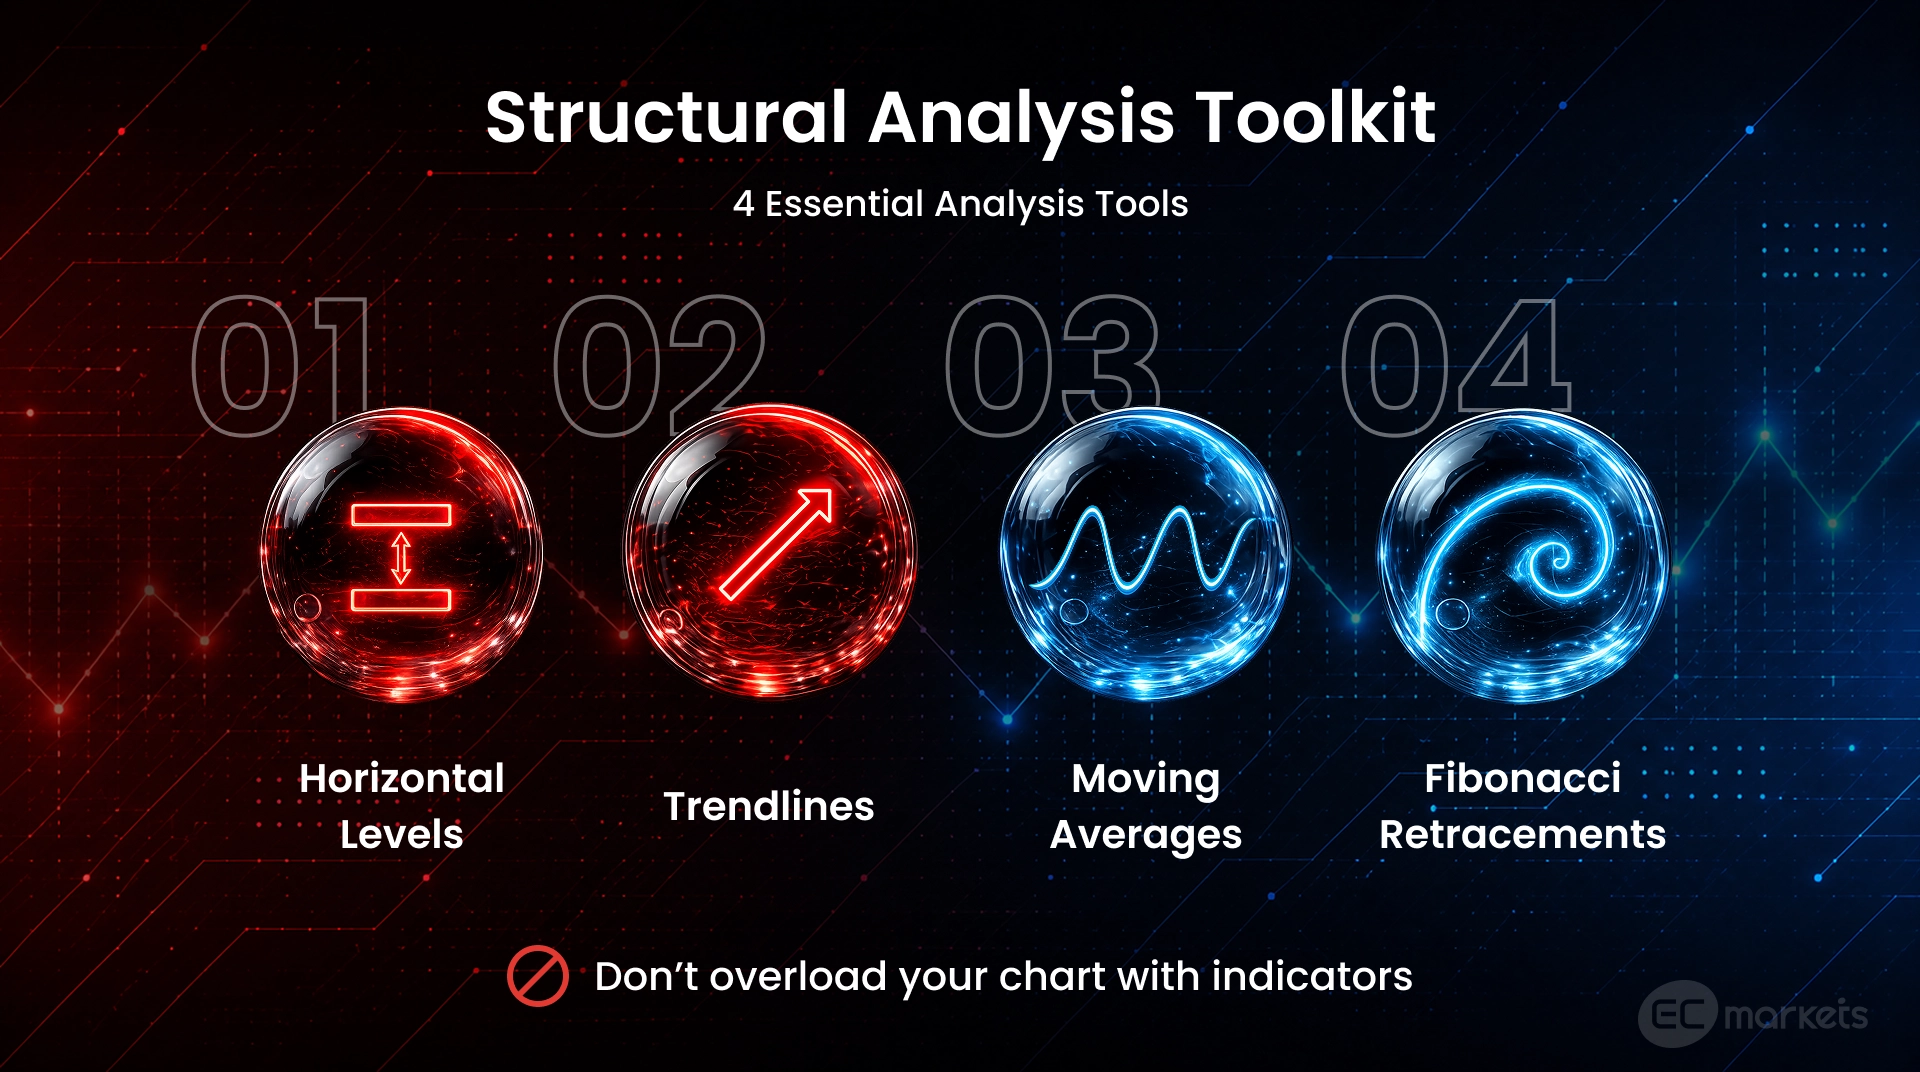
Reading market structure comes down to the eyes first, but a few simple overlays can make the process of learning how to find support and resistance levels easier. The aim is not to treat indicators as ‘magic lines’ that dictate decisions on their own — it is to use them as supporting references and watch for alignment. When several tools point to the same area, that level usually deserves more attention.
- Horizontal Levels: identify a clear ceiling or floor by marking prior highs or lows where price clearly turned.
- Trendlines: diagonal lines allow traders to capture the slope of a move. They can assist with visualising rising support in an uptrend or falling resistance in a downtrend, especially when price respects the trendline multiple times.
- Moving Averages: popular moving averages, like the 50-day and 200-day, are good context tools that give traders a big picture read. If price is holding above an average (signalling an uptrend), the support levels below carry more weight, and if price is holding below an average (signalling a downtrend), the resistance levels matter more.
- Fibonacci Retracements: this is a great confirmation tool in support and resistance trading. Fibonacci retracements are used to predict how far price is likely to pull back when it is in a trend. Retracement levels are different horizontal lines drawn based on percentages from the Fibonacci number sequence. If a retracement level happens to sit right where an old support level already is, now two independent reasons point at the same price and this confluence is what gives the zone weight.
A final caution: avoid making an ‘indicator soup’. The last thing any trader needs is a messy chart when support and resistance trading. Stacking tool on top of tool doesn't sharpen the read — it buries the very structure being analysed under a pile of conflicting signals. Skill develops from the opposite habit: working with a few trusted tools, applying the same rules every time and studying enough charts to the point where the same support, resistance, and rejection patterns become instantly recognisable in any condition.
Support and Resistance Trading: Bounces, Breakouts and Ranges
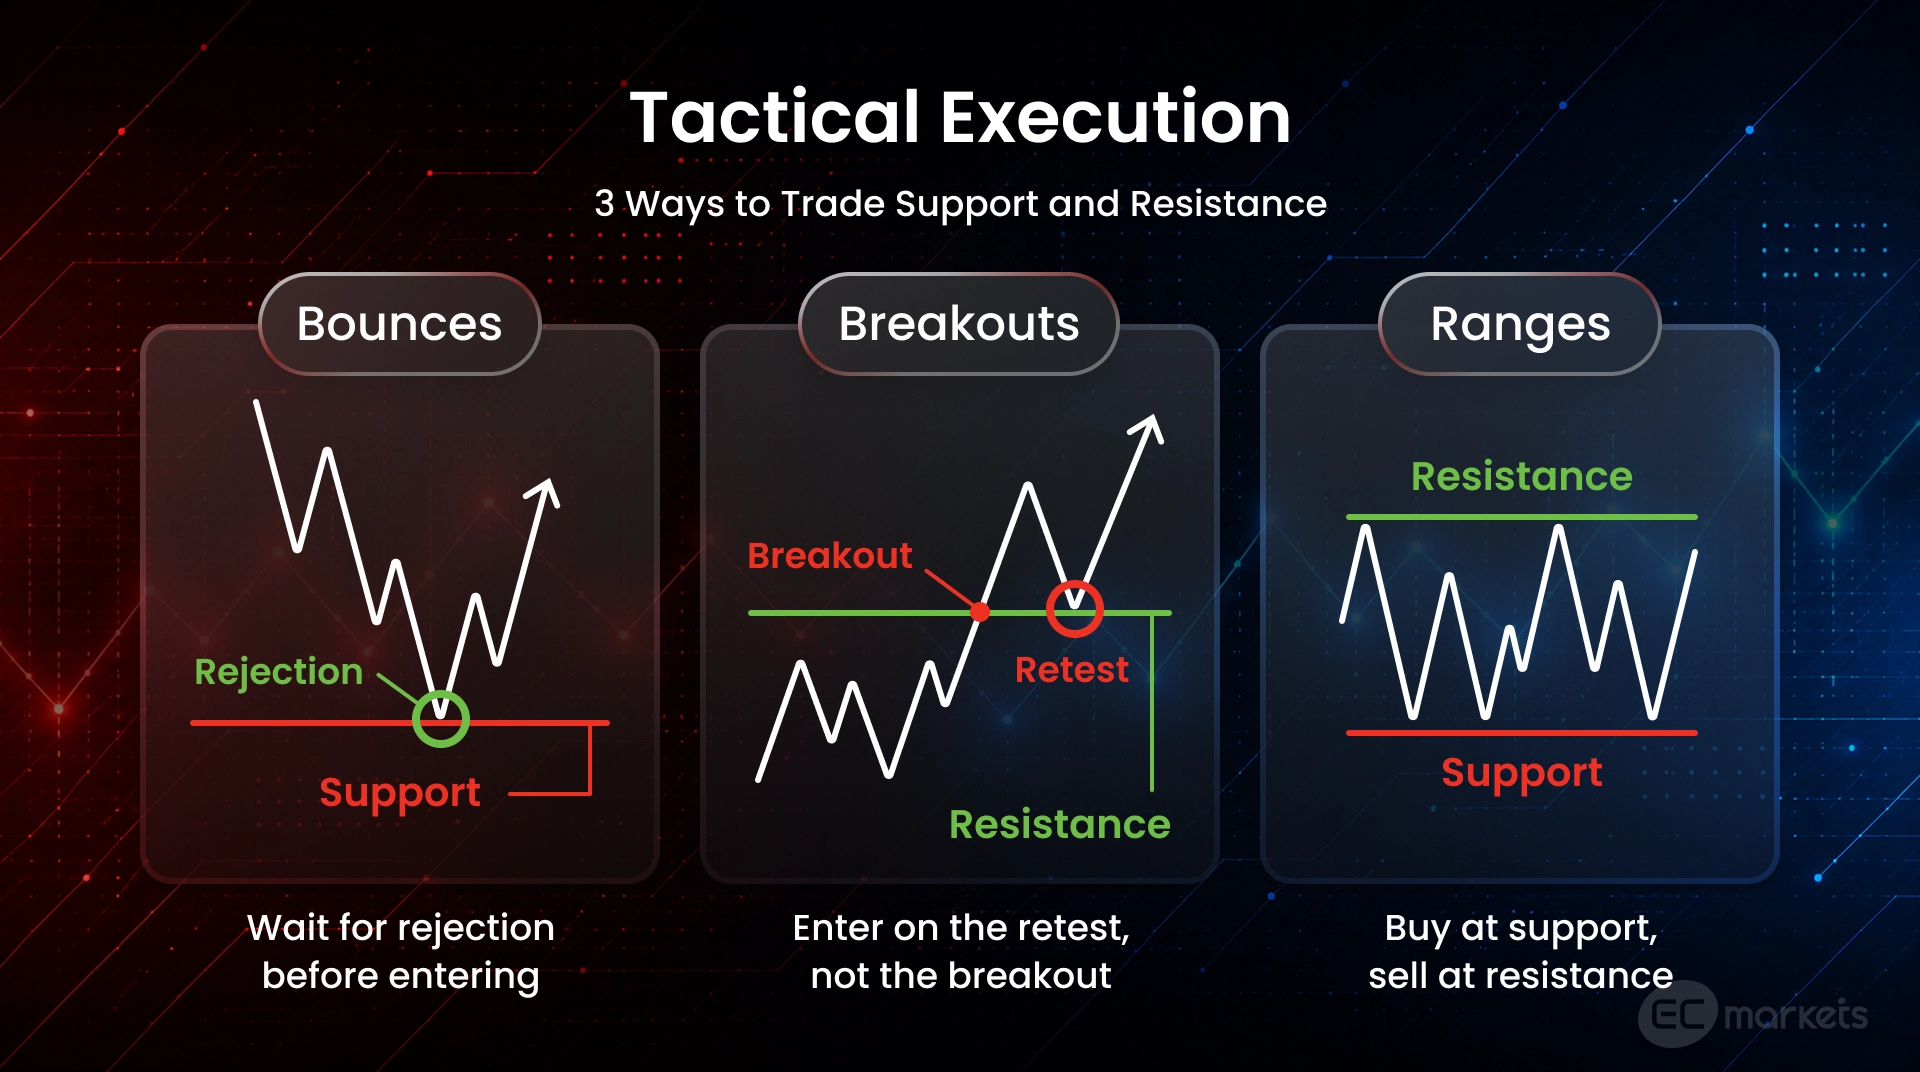
Answering 'what is support and resistance in trading?' and knowing how to find support and resistance levels are both essential. The third and hardest is making sound trading decisions when price actually reaches those zones. One thing that is important to remember in support and resistance trading is to treat these key levels as hints, rather than signals to buy or sell. Experienced traders know to wait for confirmation of a key level holding or breaking before making a decision to trade.
Bounces: A bounce trade should never be based on the first tap alone. Rejection needs to be visible first in the form of a wick, a sharp snap back or a failed push that cannot stay below the zone. This is the more disciplined approach. The goal is not to predict support or resistance, but to react to the market's inability to break it.
Breakouts: An effective way to trade a breakout is to wait for a 'retest.' A retest is when price breaks past a support or resistance zone and then retreats to touch it again. If the price does not retreat past support or resistance on the bounce, it is likely that the key level’s role has flipped i.e. resistance has become support, or support has become resistance. This indicates that the market is accepting the new price direction. Trading at this point is safer because the market has already proven that the trend has changed.
Ranges: Sometimes in support and resistance trading, price stops trending and just bounces back and forth between a high level and a low level. This is called a range. In a range, the basic idea is to buy near the floor and sell near the ceiling. A stop loss should sit just outside the floor or ceiling, not right on it. Here's why that placement matters. As long as price keeps bouncing inside the range, the plan is working. But once price pushes past the ceiling or the floor, the range is broken — and breakouts often move far and fast in the new direction. At that point the original plan no longer makes sense, so the stop loss triggers an exit quickly to protect the account.
Conclusion | How to Find Support and Resistance Levels
Support and resistance trading begins with understanding that these levels are not just lines on a chart — they are the zones where real buying and selling activity has repeatedly taken place. Here are the key takeaways:
- What is support and resistance in trading? Support marks where demand has previously stepped in to absorb selling pressure. Resistance marks where supply has previously prevented prices from climbing higher.
- Levels carry weight because market participants, including institutional algorithms, act on them. The more traders and algorithms watching the same zone, the greater the likelihood of a meaningful price reaction when that zone is reached.
- Knowing how to find support and resistance levels is only half the process. The real skill is using them to define risk, not to predict outcomes. A support or resistance zone is most valuable as an invalidation point.
- Breaks are just as important as bounces. No level holds indefinitely. When a key zone fails, it often triggers strong momentum in the new direction and that move deserves just as much attention as a reversal.
The answer to 'what is support and resistance in trading?' is simple, but applying it consistently is where the real work begins. For beginners who are still learning how to find support and resistance levels, marking the levels inconsistently is completely normal at this stage. Like most skills in trading, it improves with screen time and repetition — the more charts studied and zones tracked, the more natural and reliable the process becomes.
Note:
This content is for general information and educational purposes only and does not constitute investment advice or a personal recommendation. Any examples are for illustration only and should not be treated as a signal or invitation to trade. This material does not take into account your investment objectives, financial situation or needs. CFD trading is high-risk; losses may exceed deposits.