













Trendlines, Trend Analysis and Trend Trading Explained
Reading any chart starts with filtering out the chaos by figuring out the market’s primary direction. The trendline is the clearest visualisation of direction, and market trend analysis is what enables traders to determine whether buyers or sellers are dominating the market. Trendlines and momentum tools are not for outsmarting the market, but for acting as guardrails to follow the path of least resistance. That is the foundation of trend trading, in which the goal is not about calling the exact bottom, but about joining a move once the direction is confirmed. This article will cover the core principles of market trend analysis, from identifying the three types of trends to validating trendlines. It will then go into how these can be applied in a practical sense by explaining how trend trading and trendline trading work.
What is a Trendline?
A trendline is a straight diagonal line drawn on a price chart to show the overall direction of price.
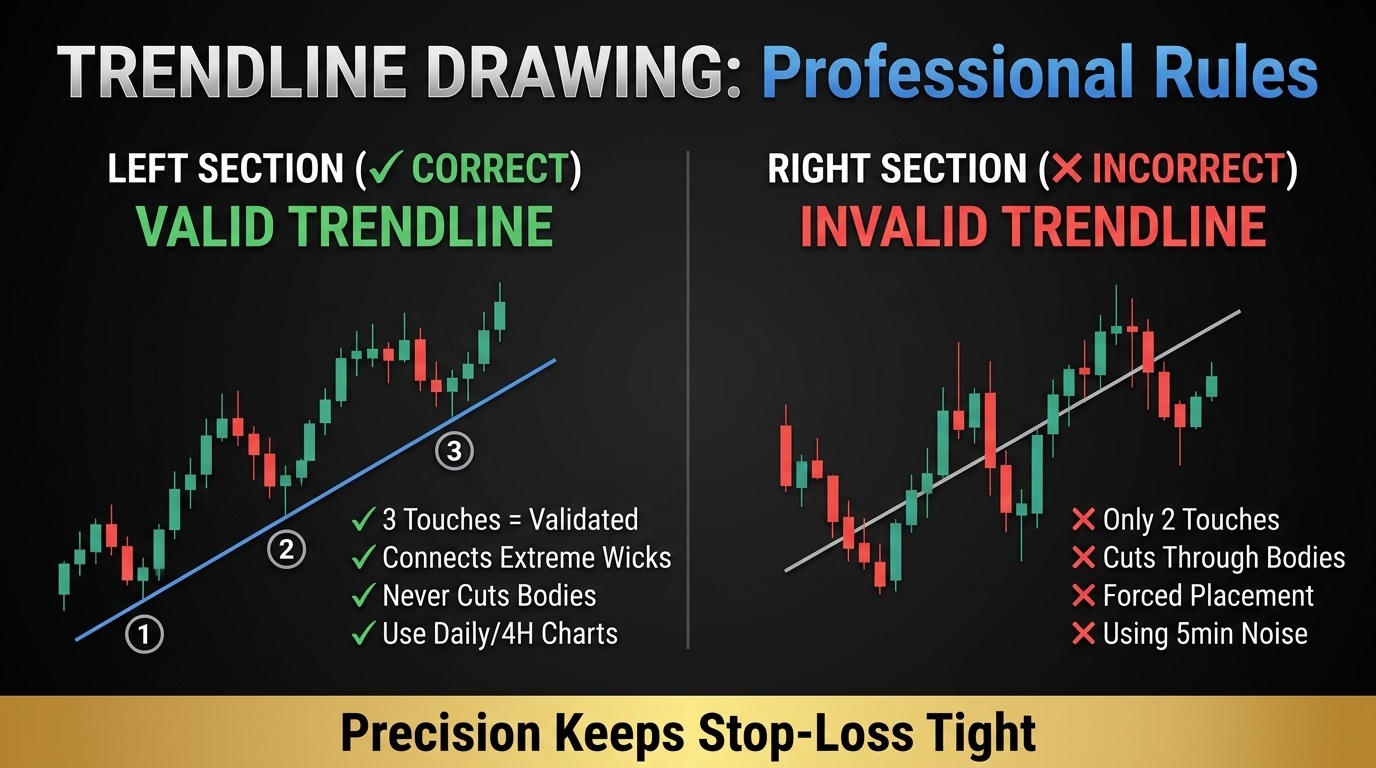
How to Draw a Trendline
- Zoom out to the Daily or 4-Hour chart to remove intraday noise.
- Connect the extreme wicks – the absolute highs or lows.
- Never cut through the body of a candle – if the line slices through price action, the trend is not valid.
How to Validate a Trendline
- Three-Touch Rule: Two points make a line. Three touches make it valid. A trendline connecting only two points is provisional. Only when price returns to the line a third time and reacts does it become active. That third touch is confirmation that the market is respecting that level.
- When the line breaks: A trendline break is not a reason to panic – it is information. If price closes decisively on the wrong side of the line, the trend is no longer valid. In this case, the correct response is to exit or reassess, not hold and hope. The trendline defines the risk boundary. A decisive close beyond it means the structure it represented no longer holds.
What is Market Trend Analysis?
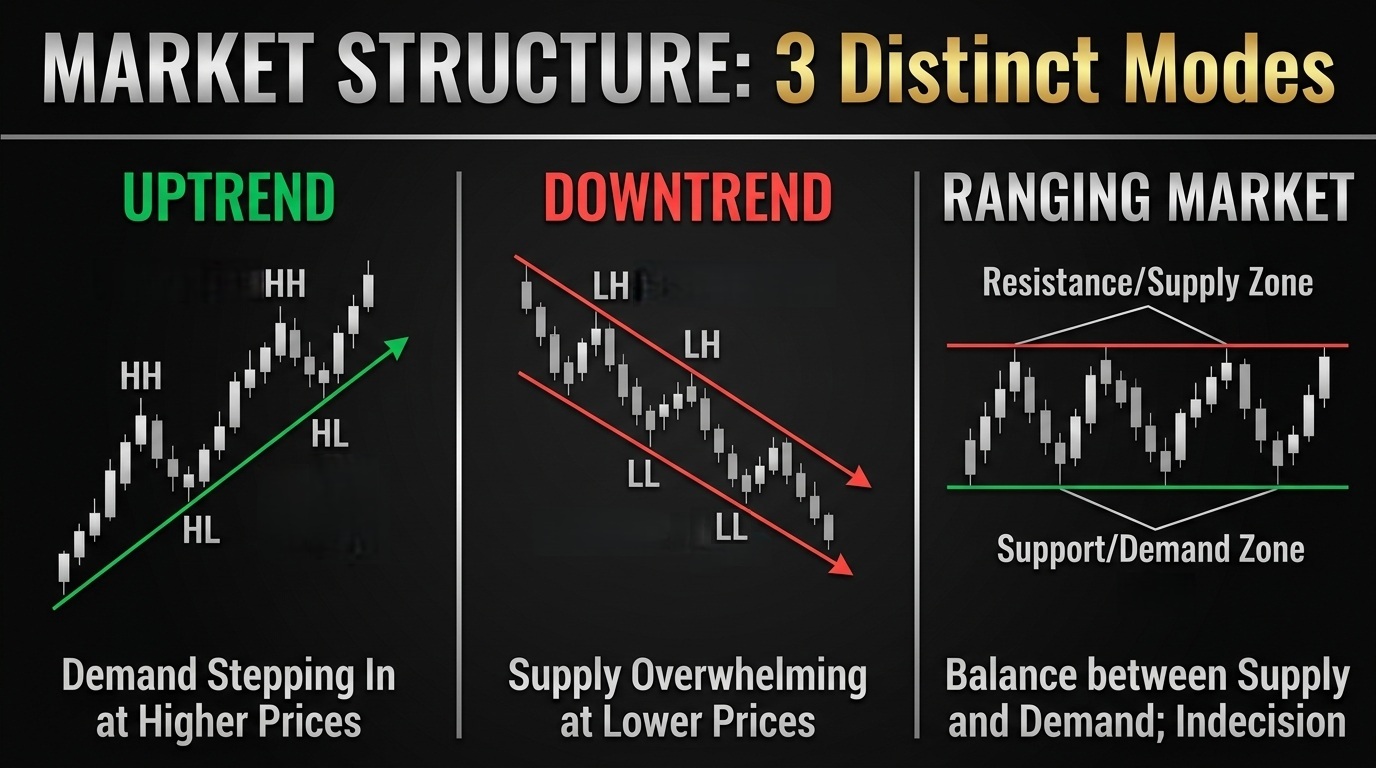
Market trend analysis is the process of identifying the clear directional bias of the market by filtering out random price fluctuations and focusing only on the significant market moves. This is an important first step to take before making any trading decisions, especially in trend trading, where the goal is to trade in the direction of the market – not against it. There are three types of trends that a market can be in at any given moment:
- Uptrend: Price is making higher highs (HH) and higher lows (HL). Each rally reaches a new peak, and each pullback holds above the previous low. Buyers are in control.
- Downtrend: Price is making lower highs (LH) and lower lows (LL). Each bounce fades before reaching the last high, and each drop falls below the previous low. Sellers are in control.
- Range (Consolidation): Price is trapped in a horizontal corridor, bouncing between defined floor and ceiling levels.
Use Multi-Timeframe Trend Analysis
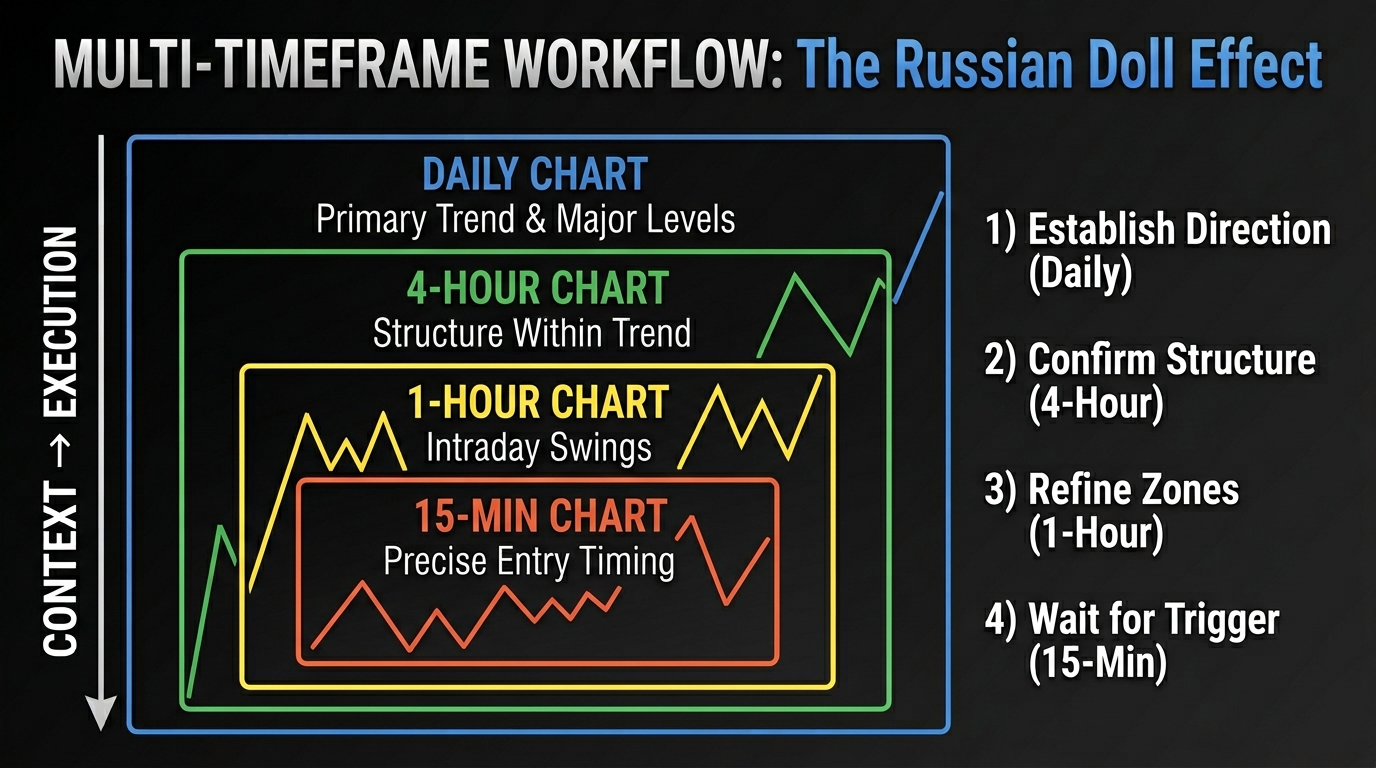
Market trend analysis is rarely reliable on a single chart. Experienced traders always apply the 'Russian Doll Effect', which means using the higher timeframes to build context, then the lower ones to execute with precision. Price tends to form similar structures at different scales. What matters is knowing which scale is driving the bigger direction and which scale should be used for execution – a move that looks like a crash on a 5-minute chart is often just a normal pullback on the daily chart.
A simple top-down approach:
- Daily: Establishes the primary trend and major price levels. This is the backdrop. Everything else is interpreted within it.
- 4-Hour: Shows how price is behaving within that backdrop. Is the trend still clean, or is a deeper correction or range developing?
- 1-Hour: Shows intraday swings and where momentum is building or fading.
- 15-Min / 5-Min: Used for entry timing.
The point is not to watch more charts, but to use higher timeframes for direction and lower timeframes for precision. A well-timed entry on a lower timeframe allows for a tighter stop, which improves risk control and risk-to-reward, provided it remains aligned with the higher timeframe structure.
A Simple Checklist for Market Trend Analysis
Market trend analysis works across asset classes – the same structural logic reads forex, indices and commodities alike. Trading is about consistently following a structured process, rather than leaving decision-making to guessing and intuition. Below is a simple checklist to help with applying market trend analysis to the live market.
- Confirm the existence of a clear trend. If the sequence is inconsistent or the chart looks choppy with no clear direction, there is no tradable trend.
- Identify which side of the market to trade. The trend is not a signal to place a trade – it only indicates which side of the market to be on. A specific entry point still needs to be found before a position is taken.
- Check for confluence across timeframes and levels. The more factors pointing to the same conclusion, the higher the probability of a valid setup. Look for trend alignment between higher and lower timeframes. Check if price is reacting strongly at a key level, such as a support zone or moving average.
- Recognise when the trend has ended. A structural break, like an uptrend failing to make a new higher low, is a signal to exit or reassess, not hold and hope for a recovery.
What is Trend Trading?
Trend trading is about taking positions that capture the high-probability middle section of a market move, rather than trying to time the absolute tops or bottoms. Traders are not looking for daily noise, but tracking massive, institutional shifts that span weeks or months. A market with a clear direction has momentum behind it and trading with that momentum means moving alongside institutional money. It is the institutions that move markets – their order flow is large enough to sustain price in one direction for extended periods, which is precisely what gives a trend its durability. Trading against it means taking on unnecessary risk with the odds working against the trade.
Here is how trend trading works in practice:
- Direction first. Before any entry, the dominant trend must be clearly established.
- Wait for pullbacks. Even in a strong trend, price pulls back before continuing. These retracements are the entry opportunity, as opposed to entering at the initial breakout when price is overextended. Look for price to react strongly off a key support level or moving average, such as a sharp rejection or a decisive close in the trend's direction, as confirmation before entering.
- Actively manage risk. Scaling out (closing portions of the trade) at target levels locks in profit as the trend matures. A trailing stop protects gains without requiring a perfect exit.
- Know when to step aside. Trend trading also defines where to step away. When market structure breaks, such as an uptrend failing to make a new higher low, the trend can no longer be trusted. That is a signal to reassess, not react.
At its core, trend trading turns market trend analysis into action, giving each decision a defined level to react to rather than a vague sense of direction. It is not about predicting what price will do next – it is about identifying what price is already doing, then aligning with it. Trading in the direction of an established trend puts probability on the right side of the trade – fighting against it means fighting an uphill battle.
What is Trendline Trading?
Trendline trading is a specific type of trend trading that focuses on identifying entry and exit points using trendlines. Accuracy is the foundation of trendline trading – a poorly drawn line produces false signals, so getting the slope right is where the discipline begins. Once a valid trendline is drawn, it acts as a dynamic support level (for uptrends) or resistance level (for downtrends). So how does entry and exit work?
There are two key entry signals to look out for in trendline trading, both of which have close prices that indicate the trendline is being respected:
- Rejection wick – a wick sticking through the trendline and the candle’s body closing back in the trend’s direction.
- Decisive close – price touches the trendline (without breaking through it) and closes firmly in the trend's direction.
Just like in any other trading style, risk management is key in trendline trading. Here are two important steps to protect against losses and ensure a timely exit:
- The stop-loss is placed on the other side of the trendline. If price closes beyond the trendline, the setup is invalidated because at this point, the trendline is no longer acting as support or resistance.
- From there, the trade is managed the same way as any trend trade: scaling out at targets as the move matures, or trailing the stop to protect gains.
Trendline trading tends to suit traders who prefer a visual, rules-based approach over reading multiple indicators. The main advantage of trendline trading is clarity of decision: price is either respecting the line or it is not. This method may sound simple, but the real challenge lies in trading it with discipline and sticking to the rules.
Alternatives to Trend Trading
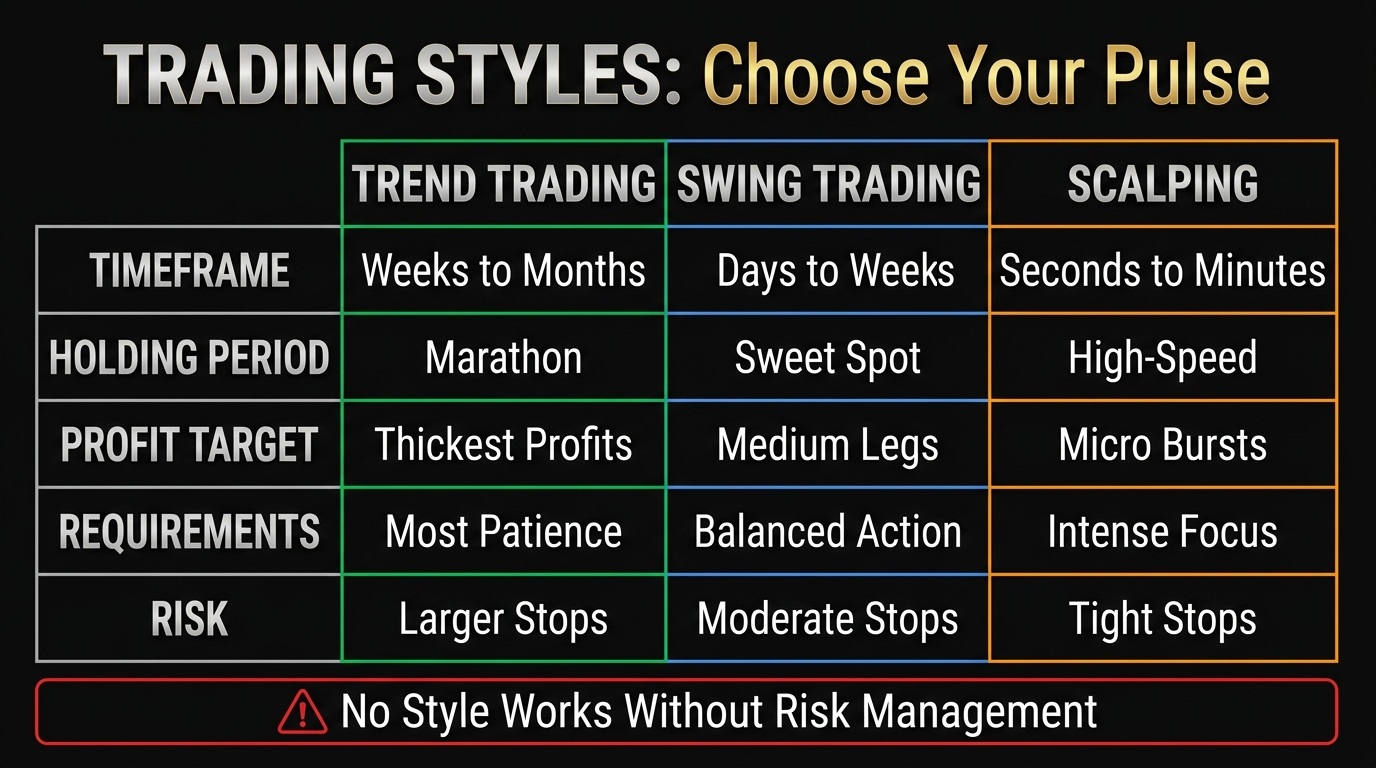
While trend trading is a popular way to trade, it is not the only way to trade. Trend trading is a style that requires the most patience. No trading style, by itself, is considered objectively better than the others and no single style is proven to make more money than the others. The best trading style for a trader depends on their preferences for time and volatility. A trading style is suitable as long as it can be sustained over the long term. Let’s look at two other styles of trading:
- Swing Trading
This style aims to capture the market’s secondary trends by holding a position for a few days. This is ideal for traders who prefer something in between a short-term (scalping) and long-term (trend trading) approach. - Scalping
Scalpers are high-speed momentum hunters, battling against spreads and execution speed. They enter and exit in seconds or minutes, but they only win if they align their micro-bursts with the macro tide.
Conclusion | Trendlines, Trend Analysis and Trend Trading Explained
Trend analysis is not about predicting the next move, but about recognising what price is already doing and aligning with it. Trendlines and momentum tools are instruments for identifying bias, not forecasting the future. They make direction visible, marking the levels where momentum tends to hold or break. Together they give trend trading and trendline trading their edge: a disciplined way to stay on the right side of the market until the math signals the exit, rather than guessing at tops and bottoms. The aim on a demo account is not to simply draw lines, but to test the discipline to follow a structural checklist once the candles start moving. The more the focus sits on the integrity of the process rather than the 'feel' of the market, the faster the shift from hobbyist to operator.
Note:
This content is for general information and educational purposes only and does not constitute investment advice or a personal recommendation. Any examples are for illustration only and should not be treated as a signal or invitation to trade. This material does not take into account your investment objectives, financial situation or needs. CFD trading is high-risk; losses may exceed deposits.