

Why Candle Size Matters: Understanding Candlestick Bodies and Ranges


Candle size can reveal useful information about price movement, but a large candlestick body does not necessarily mean price moved steadily in one direction, just as a small body does not always indicate a quiet trading session.
The key is understanding the difference between the candle’s body, which measures the opening-to-closing price change, and its full range, which captures the highest and lowest prices reached during the period.
Reading both helps traders interpret historical price behaviour without assuming that candle size predicts what happens next.
What Does a Candlestick Show?
A standard candlestick displays four prices: the opening price, the highest price, the lowest price and the closing price.
The opening price marks the beginning of the period, while the closing price marks its end. The high and low show the extremes recorded within that period.
The body connects the opening and closing prices. The thin lines, called wicks or shadows, extend towards the high and low.
A rising candle closes above its opening price; a falling candle closes below it. Green and red are common colours, although chart settings can change their meaning. Candle colour does not necessarily show whether the close was above or below the previous candle’s close.
On a daily chart, each candle represents one daily trading period. On an hourly chart, each represents one hour.
Candlestick Body vs Full Candle Range: What’s the Difference?
Body size measures the absolute difference between the opening and closing prices. “Absolute” means the size of the difference, regardless of direction.
Body size = Absolute difference between opening and closing prices
Full range = Highest price − Lowest price
Consider a hypothetical candle:
| Price | Hypothetical value |
| Open | 100 |
| High | 106 |
| Low | 98 |
| Close | 101 |
| Body size | 1 |
| Full range | 8 |
This candle has a small body but a comparatively wide range. Price reached 6 above and 2 below the opening price, although it finished only 1 above where it began.
A small body therefore does not necessarily mean little price movement or low volatility. The full range provides additional information.
What Can a Larger Body Show?
A larger body represents a greater difference between the opening and closing prices.
A large rising body shows that the closing price was considerably higher than the opening price. A large falling body shows the opposite, with the closing price considerably lower.
“Large” is a relative description. A body may appear substantial compared with nearby candles on the same instrument and timeframe, but ordinary during a more active period.
The body alone does not establish trading volume, institutional activity or the cause of the movement. A news explanation requires separate evidence.
Nor does a large body show that price moved continuously in one direction. A candle summarises four prices without revealing every movement between them or the order in which the high and low occurred.
What Can a Smaller Body Show?
A smaller body means the opening and closing prices are relatively close together.
This may occur during quieter trading, a pause within a trend or a session containing substantial movement in both directions.
The wicks and full range help distinguish these situations. A small body with short wicks differs from a small body surrounded by long wicks.
A series of small bodies with narrow ranges may suggest relatively limited recent movement. However, the wider chart is needed to assess whether this forms part of consolidation or another market condition.
An individual small body does not prove indecision or establish that a reversal is approaching.
Why Context Matters
Compare candles on the same instrument, timeframe and chart scale.
An hourly candle and a daily candle cover different periods, so their sizes cannot be interpreted on an equivalent basis.
Zooming or changing the vertical price scale can also alter a candle’s apparent size without changing its underlying prices. Check the price values rather than relying entirely on visual impressions.
This article’s chart uses standard candlesticks on a linear scale, where equal vertical distances represent equal price differences.
For a broader understanding of how price movements fit into market trends, explore the foundations of technical analysis, including Dow Theory, Wyckoff and Fibonacci retracements.
Candle Size in Practice
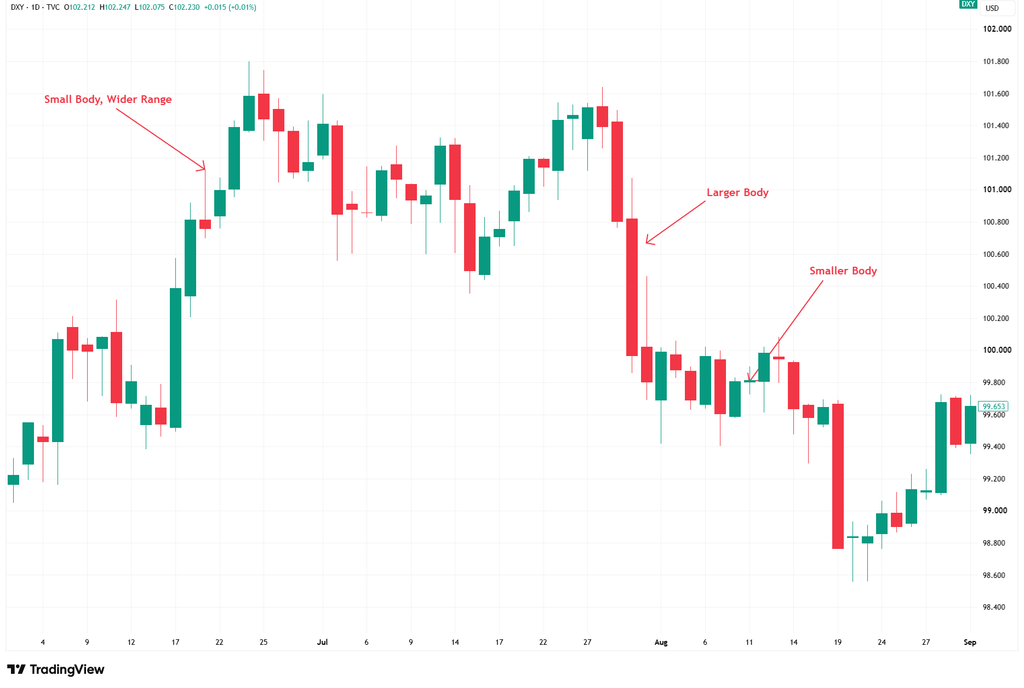
The US Dollar Index (DXY) provides practical examples of how candle body size and full trading range can differ. The chart below highlights these variations across several daily trading sessions.
US Dollar Index (DXY) daily candlestick chart, June-September 2026
Source: TradingView, Past performance is not a reliable indicator of future performance. Data as of 14 October 2026.
Chart source and methodology: Standard daily candlesticks are displayed on a linear price scale without indicators. Bodies show opening to closing differences; full ranges extend from the lowest to the highest price. Annotations are educational.
The annotations compare larger and smaller candle bodies and illustrate how a small body can coexist with a wider high to low range.
Small Body, Wider Range (June): The June candle identified by this annotation has a small red body beneath a comparatively long upper wick. Its opening and closing prices are close together, although its full range is considerably larger than its body.
Larger Body (July): The tall red candle near the end of July shows a substantial decline between the opening and closing prices compared with several surrounding candles.
Smaller Body (August): The nearly flat green body around 99.8 indicates that the opening and closing prices were very close together.
Together, these examples distinguish the change from open to close from the full range recorded during a session. They do not establish what the price will do next.
Limitations of Candle Size Analysis
Candle size alone cannot establish why a price movement occurred, how much trading volume was involved or what price will do next.
A large candle does not guarantee continuation, while a small candle does not necessarily signal an approaching breakout or reversal. Similarly, long wicks do not guarantee that a particular price level will hold.
Candlesticks also provide only a summary of price movement within a given period. They do not reveal the full sequence of price changes between the open and close.
For a more complete picture, candle size should be considered alongside surrounding candles, support and resistance levels and wider price structure.
Bottom Line
Understanding candle size starts with recognising the difference between the body and the full range.
The body measures the opening-to-closing price change, while the full range captures the distance between the highest and lowest prices recorded during the period.
Reading both helps traders interpret historical price behaviour more accurately, without treating candle size as a reliable predictor of future price direction.