
Why the Closing Price Matters: Where Did the Session Finish?


The closing price shows where a market finishes at the end of a trading session or selected chart period. But that price may be very different from the highest or lowest level reached along the way.
A market can rise considerably during a session and still close well below its high. Understanding this distinction helps traders interpret completed candlesticks and compare price movements across different periods.
While the closing price provides an important reference point for technical analysis, it does not predict where prices will move next.
What Is the Closing Price?
The closing price is the final price recorded for a completed chart period, although its exact calculation may depend on the instrument, trading venue and data provider.
A daily candle represents one daily trading period, while an hourly candle represents one hour. Each completed candle has its own close. An hourly candle’s close is therefore not necessarily the daily session’s closing price.
An unfinished candle is different. Its latest price continues changing while the period remains open and should not be treated as a final close.
A chart candle’s close should also be distinguished from an exchange’s official closing price. Exchanges may use a closing auction, where orders are brought together to determine a closing price, or another method under their rules.
Finding the Close on a Candlestick
A standard candlestick displays the opening, high, low and closing prices.
The body connects the open and close. The thin lines extending beyond it, called wicks or shadows, show the highest and lowest prices.
On a rising candle, the close is at the top of the body. On a falling candle, it is at the bottom. A wick tip marks an extreme, rather than necessarily marking the close.
Green and red commonly identify rising and falling candles, but colours can be customised. This article’s chart uses colours based on each candle’s own opening and closing prices.
For a broader introduction to how candlesticks represent price movements, explore our guide to candlestick patterns.
The Session High Is Not the Closing Price
Consider a hypothetical market:
| Price | Hypothetical value |
| Open | $100 |
| High | $106 |
| Low | $98 |
| Close | $102 |
The market reached $106 but did not finish there. It closed $2 above its opening price and $4 below its session high.
Both comparisons are correct. One describes the change from open to close; the other describes how far the closing price finished below the highest recorded price.
The candle does not reveal whether the high occurred before or after the low. Finishing below the high also does not establish that the price will fall next.
Closing Near the High, Low or Middle
The position of the closing price within a session’s high-to-low range can provide additional context about how the period finished.
Closing Near the High
The session finished near its highest recorded price. The close may equal the high or sit slightly below it.
This describes its position within the session’s range, without guaranteeing further gains.
Closing Near the Low
The session finished near its lowest recorded price. This provides information about where the period ended but does not guarantee further declines.
Closing Near the Middle
The close finished around the middle of the session’s range, away from both extremes.
This does not automatically establish indecision, sideways conditions or an approaching reversal. None of these closing positions alone reveals trading volume, institutional activity or the cause of the movement.
Closing Above the Open vs the Previous Close
A rising candle closes above its own opening price. A gain compared with the previous session means the close is above the previous session’s close.
These are different comparisons.
A green candle can still finish below the previous session’s close if it opened sufficiently lower. Its colour describes the movement from its own open, rather than necessarily showing a gain from the previous session.
The Closing Price in Practice
Gold’s daily candlestick chart provides a practical example of how the closing price can differ from a session’s highest and lowest prices. The annotated candle below highlights these three reference points within a single trading period.
XAU/USD daily candlestick chart, September to October 2026
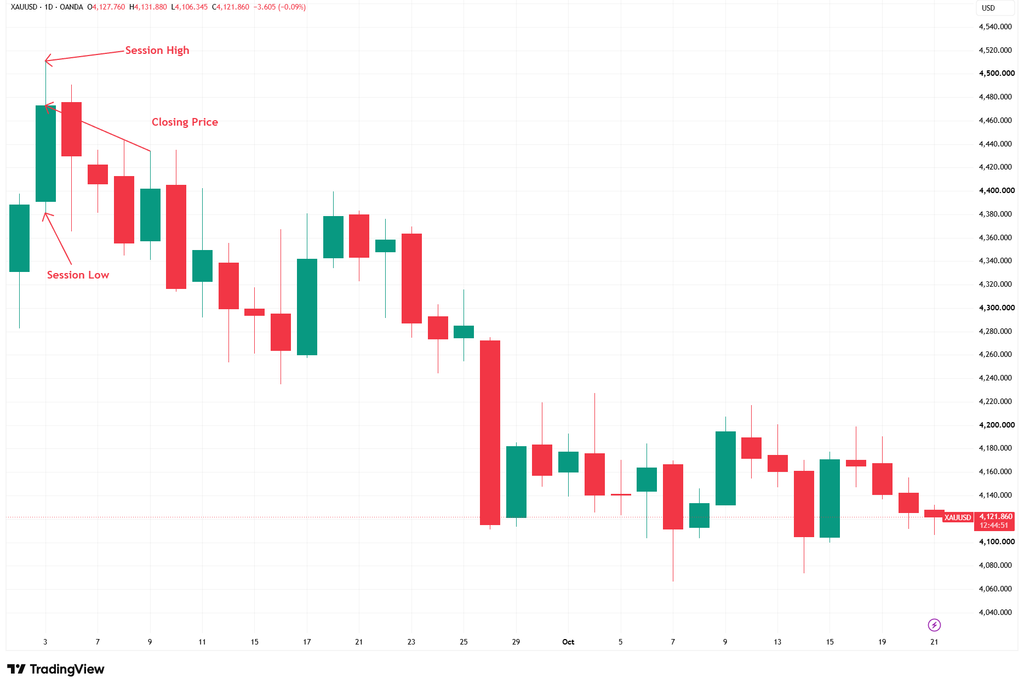
The annotated green candle above 3 September shows three distinct reference points within the same session.
Session High: The arrow identifies the top of the upper wick, marking the highest price recorded during that daily period.
Session Low: The arrow identifies the bottom of the lower wick, marking the lowest price recorded during the session.
Closing Price: The arrow points to the top of the green body, showing where the session finished, above its opening price but below its highest recorded price.
The upper wick makes the distinction visible: gold reached a higher price during the session than the level at which it eventually closed.
Limitations of Closing Price Analysis
The closing price is only one reference point within a wider price record. It does not reveal the full sequence of price movements during a session or establish what happens next.
A close near the high does not guarantee further gains, while a close near the low does not necessarily signal continued weakness.
Closing prices should therefore be considered alongside surrounding candles, support and resistance levels and wider price structure.
Bottom Line
The closing price shows where a trading session or chart period finished, while the high and low reveal the extremes reached along the way.
Understanding these differences helps traders interpret completed candlesticks and compare price movements more accurately.
The key is to use the closing price as a reference for historical price behaviour rather than a prediction of future direction.