


Gold vs Real Yields: Why the Metal Keeps Finding Support
Gold remains one of the market’s most closely watched defensive assets, particularly during periods of inflation uncertainty, geopolitical tension, and shifting central-bank expectations.
One of the most important drivers behind gold prices is the direction of real yields. As investors reassess inflation-adjusted returns in bond markets, the balance between holding yield-generating assets and defensive assets like gold becomes increasingly important.
That relationship continues to shape price action in 2026, although recent market behaviour suggests the picture is becoming more nuanced.
Why the Relationship Matters
Unlike bonds or savings products, gold does not generate interest or income. Because of that, one of the key macroeconomic drivers behind gold prices is the level of real yields.
In simple terms, a real yield represents the return an investor receives from a government bond after adjusting for inflation. If a bond pays 5% interest while inflation is running at 3%, the real yield is effectively 2%.
This matters because gold offers no yield.
When real yields fall, holding gold becomes relatively more attractive because inflation-adjusted returns elsewhere become less compelling. When real yields rise, gold faces a higher opportunity cost, which can place pressure on prices.
Historically, gold and real yields have often moved inversely for this reason.
However, the relationship has become more complex in recent years. Even during periods where yields have risen, gold has at times remained resilient due to central-bank buying, geopolitical uncertainty and broader defensive demand.
Reading the Real Yield Relationship
The relationship between gold and real yields remains one of the clearest macro themes precious metals traders monitor today.
Comparing gold prices against the US 10-year real yield often helps reveal how broader macro conditions are evolving beneath the surface.
Recently, price action has reflected a growing tug-of-war between firmer yields and persistent defensive demand.
Gold Market Technical Map (May 2026)
- Major Resistance: $4,700/oz
- Current Spot Price: $4,483/oz
- 200-Day Moving Average Support: $4,359/oz
On the daily chart, gold has shown notable resilience in recent weeks.
Each time US real yields softened or paused their upward move, buyers quickly returned to the market.
What has stood out most is gold’s ability to continue stabilising above key support zones even during temporary rises in real yields.
Rather than breaking down aggressively under rate pressure, the metal has repeatedly held above its 200-day simple moving average near $4,359.
That type of behaviour often attracts attention because it suggests underlying defensive demand remains active beneath the surface.
In practical terms, sellers have struggled to force a deeper breakdown even when macro conditions became temporarily less supportive.
What the Chart Is Showing
The broader technical structure now provides traders with a relatively clear roadmap.
The 200-day moving average near $4,359 remains the key long-term support level. As long as gold continues holding above this area, the broader uptrend structure remains intact.
On the upside, resistance is beginning to build around the $4,700 region after several recent rallies failed to break decisively above that level.
This creates a relatively defined range where traders can monitor whether momentum strengthens or fades.
Momentum conditions have also moderated.
The Relative Strength Index (RSI), which measures the speed and strength of price movements, has eased from earlier overbought levels and is currently sitting near 37.
Importantly, that does not automatically signal weakness.
During strong trends, periods of RSI moderation often allow markets to build a healthier technical base following aggressive buying phases. Traders typically prefer this type of stabilisation over unsustainable momentum spikes.
There are also signs of divergence emerging between gold and yields themselves.
During brief periods where US 10-year real yields pushed toward 2.13%, gold still refused to break down aggressively.
That resilience may suggest institutional demand for defensive assets remains active despite relatively firm real-rate conditions.
Combining Macro Themes With Technical Structure
For traders, the key is combining macro conditions with technical confirmation rather than relying on either in isolation.
Real yields help explain where pressure may be building beneath the surface, but chart structure shows how markets are actually responding to that pressure.
Support and resistance levels, moving averages and momentum indicators all help traders assess whether buyers are genuinely stepping back into the market.
This also ties closely into broader market psychology.
Gold often attracts demand during periods of concern around inflation, central-bank credibility or wider economic uncertainty.
Because of this, traders pay close attention to how gold behaves during periods where yields temporarily rise.
If yields move higher but gold continues holding above support, many traders interpret that as a sign that larger investors still view precious metals as an important defensive allocation.
Gold Spot Price vs US 10-Year Real Yield
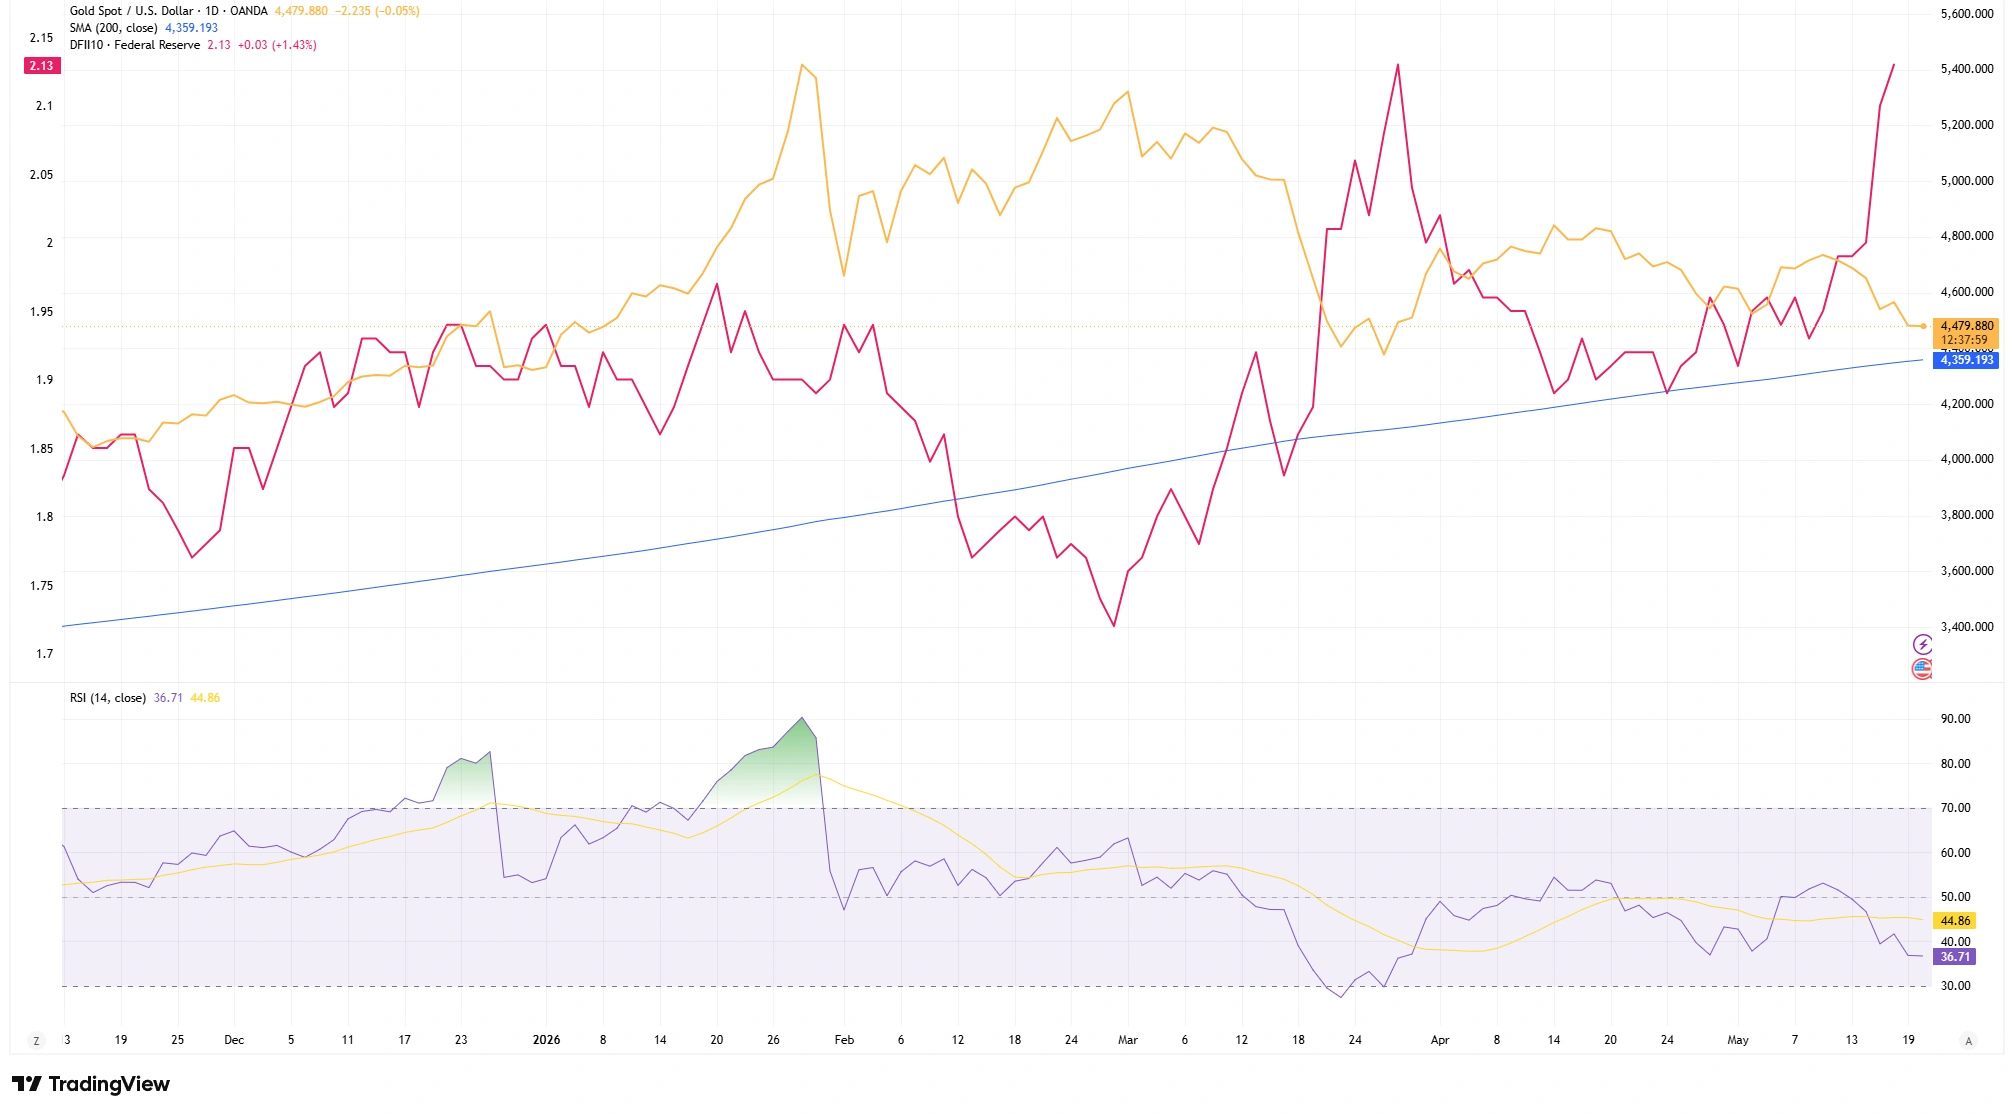
Source: TradingView. Past performance is not a reliable indicator of future performance. Data as of 20 May 2026.
A comparison of gold prices and US 10-year real yields highlights how the metal has continued finding support despite periods of firmer inflation-adjusted bond yields.
Bottom Line
The relationship between gold and real yields remains one of the most important macro guides for precious metals traders.
While falling real yields generally support gold prices, technical confirmation still matters. Support levels, momentum indicators and broader price structure help determine whether macro conditions are translating into genuine buying demand.
At the moment, gold continues showing resilience even within a relatively firm yield environment.
That does not remove the risks facing the metal, but it does suggest defensive demand remains active beneath the surface.
Real yields may shape the broader macro theme, but the chart still determines whether buyers are willing to act on it.