
Inside Bar Explained: Price Within the Previous Candle's Range


Table of Contents
An inside bar, also known as an inside candle, forms when a candle’s entire price range sits strictly within the range of the previous candle. It is identified by comparing the highest and lowest prices recorded across two completed periods.
Rather than focusing on whether the candle is green or red, the comparison looks at its price boundaries.
An inside bar provides context about recent price behaviour but does not predict which direction the market will move next.
What Is an Inside Bar?
This article uses a strict definition: the inside bar’s high must be lower than the previous candle’s high, and its low must be higher than the previous candle’s low.
Its entire high to low range, including the wicks, therefore fits within the preceding range. A smaller candle does not automatically qualify; the position of both extremes matters.
The previous candle is sometimes called the “mother candle”. Some definitions allow an equal high or an equal low, but this article requires both boundaries to sit strictly inside the previous range.
The completed inside candle can be green or red. Its colour does not determine whether it qualifies.
Full Range vs Candle Body
The candle body connects the opening and closing prices, while its wicks extend towards the highest and lowest prices recorded during the period. Understanding the different components of candlestick patterns helps explain why an inside bar is identified using the full range, rather than the body alone.
A body may sit inside the previous body while an upper wick extends above the previous high. Under the definition used here, that candle would not qualify. The same applies if its lower wick extends below the previous low.
This differs from a harami pattern, whose criteria centre on candle bodies. The terms should not be treated as interchangeable.
Inside Bar: A Simple Example
Suppose the previous candle has a high of $105 and a low of $95. The next candle has a high of $103 and a low of $97.
| Price | Previous Candle | Inside Candle |
| High | $105 | $103 |
| Low | $95 | $97 |
| Range | $10 | $6 |
The second candle’s high of $103 is below the previous high of $105, while its low of $97 is above the previous low of $95. Its entire range therefore fits within the previous candle’s range. The previous candle spans $10, compared with $6 for the inside bar.
These hypothetical figures demonstrate the definition. They are not trading levels or forecasts. They also do not reveal the order in which either candle recorded its high and low.
What Can an Inside Bar Tell Us?
The later period recorded a narrower range and did not exceed either extreme of the previous period.
This may occur during a pause within a trend or a period of relatively limited movement. However, one inside candle does not establish a lasting consolidation phase, prove indecision or explain why the range narrowed.
It also does not establish low trading volume, institutional accumulation or distribution, or an approaching breakout.
The relationship concerns recorded price boundaries. It does not show every movement within the period or establish that trading occurred continuously at all prices between the high and low.
A narrower range can be observed directly. Its cause and implications require additional evidence.
Why Context and Completion Matter
Inside bars may appear during upward trends, downward trends or sideways conditions. Understanding the surrounding price action helps explain where the relationship occurred, without making it a guaranteed continuation or reversal signal.
Both candles must use the same instrument, timeframe, data feed and session settings. A daily chart compares daily trading periods, while an hourly chart compares hourly periods.
An unfinished candle may temporarily sit inside the previous range before later exceeding its high or low. Only identify a confirmed inside bar after the period has ended.
For spot gold, daily boundaries follow the provider’s session definition. Different providers need not use the same daily closing boundary.
Inside Bar Candlesticks in Practice
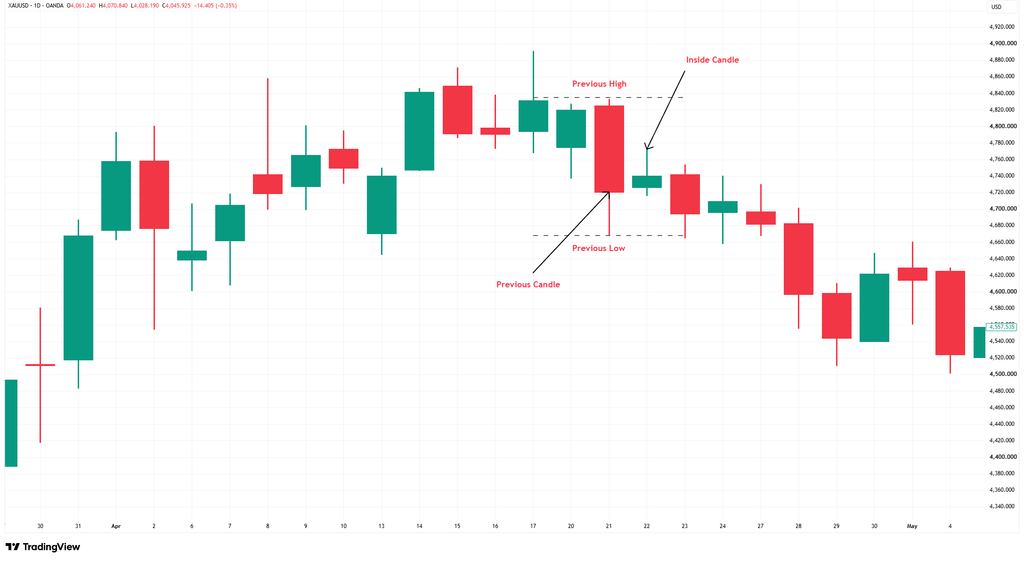
The following XAU/USD daily chart provides a real-market example of an inside bar, showing how the high and low of one completed session remain within the boundaries of the previous session.
XAU/USD daily candlestick chart, late March to early May 2026
Source: TradingView, Past performance is not a reliable indicator of future performance. Data as of 28 October 2026.
The labelled green candle on 22 April has a lower high and a higher low than the preceding red candle, placing its full range within the previous period’s range.
The chart identifies the red candle on 21 April as the “Previous Candle” and the following green candle on 22 April as the “Inside Candle”.
The green candle’s upper wick ends below the red candle’s upper wick tip. Its lower wick also ends above the red candle’s lower wick tip. The comparison therefore concerns both candles’ complete ranges, rather than their bodies alone.
The dashed guides mark the previous candle’s high and low, making the boundaries easier to compare. The green candle sits within those boundaries. Its colour plays no part in the comparison.
This example describes the relationship between two completed sessions. It does not establish the direction or strength of the next movement.
What Are the Limitations of Inside Candles?
An inside bar describes a historical range relationship rather than a complete trading decision.
A subsequent move beyond the previous range can fail or reverse. The pattern alone cannot establish the strength or duration of any later movement. Surrounding candles, support and resistance, and wider market structure provide additional context.
The defining feature is straightforward: the completed inside candle’s full range fits strictly within the previous candle’s range. This describes recent price behaviour without predicting what happens next.
Bottom Line
An inside bar describes a historical price relationship in which one completed candle’s entire high-to-low range sits strictly within the previous candle’s range.
While this narrower range may occur during a pause in market activity, it does not confirm a continuation, reversal or approaching breakout. A subsequent move beyond the previous range can also fail or reverse.
The key is to consider inside bars alongside surrounding price action, support and resistance, and wider market structure. The pattern provides useful context about recent price behaviour, but it cannot predict the direction or strength of future movements.