
Why Interest Expense Matters for Company Profits


Interest expense is the cost companies incur when borrowing money to finance acquisitions, equipment, infrastructure or everyday operations.
Interest payments may absorb a larger share of operating profit when borrowing costs rise. This means a company can maintain stable revenue and operating performance while reporting lower profits after financing costs.
Understanding how interest expense works can help investors assess a company’s profitability, debt obligations and financial flexibility.
What Is Interest Expense?
Interest expense is the cost of borrowing recognised in a company’s financial statements during a reporting period.
Borrowing may include corporate bonds, bank loans, credit facilities, lease obligations and other forms of debt. The amount borrowed and the interest rate charged help determine the resulting expense.
Consider a simplified company that earns $20 million in operating profit and pays $5 million in interest. This leaves $15 million of profit before tax.
If operating profit remains at $20 million but interest expense rises to $8 million, profit before tax falls to $12 million. The company’s sales and operating performance have not changed, but its financing costs have increased.
This is a simplified educational example and does not represent an actual company.
Why Interest Expense Can Increase
Interest expense may rise because a company takes on additional debt. Replacing existing borrowing at a higher interest rate can also increase interest expense.
We call this replacement process refinancing. Companies do not always repay maturing debt entirely with available cash. They may issue new bonds or obtain new loans to replace debt that is reaching its repayment date.
If previous debt carried an interest rate of 3% and the replacement debt cost 6%, annual interest expense may increase even if the total amount of debt remains broadly unchanged.
Variable rate debt can respond quickly to changes in market interest rates. Fixed-rate debt generally maintains the same interest rate for a specified period, but it does not eliminate refinancing risk. When fixed rate debt matures, the company may have to replace it at a less favourable rate.
Accounting treatment can also affect reported interest expense. Some borrowing costs connected with assets under development may initially be included in the value of those assets. This is known as capitalised interest. When an asset becomes ready for use, less interest may be capitalised and more may appear immediately as an expense.
How Interest Expense Affects Profit
In a simplified income statement, interest expense affects profitability as follows:
- Revenue
- Minus operating costs
- Equals operating profit
- Minus interest expense
- Equals profit before tax
- Minus tax
- Equals net income
Operating profit measures the profit generated from the company’s main business activities. Interest expense normally appears below operating profit because it relates to how the business is financed rather than the direct cost of providing its products or services.
A company can therefore report stable revenue and operating performance but weaker net income when interest expense rises.
For a broader understanding of how revenue, expenses and profitability are reported, explore our guide to reading company earnings reports.
What Is the Interest Coverage Ratio?
The interest coverage ratio compares operating profit with interest expense.
Interest coverage = operating profit divided by interest expense
If a company earns $20 million in operating profit and pays $5 million in interest, its interest coverage is four times.
If operating profit remains at $20 million but interest expense rises to $10 million, coverage falls to two times. The company has less room to absorb weaker trading conditions or further increases in borrowing costs.
Higher coverage generally indicates that interest payments are more comfortably supported by operating profit. However, there is no single level that is appropriate for every company. Suitable levels differ between industries and businesses.
Verizon: Stable Revenue and Rising Interest Expense
Verizon Communications provides a useful example of how rising borrowing costs can affect profitability, even when revenue remains relatively stable.
Between 2022 and 2025, Verizon’s revenue remained within a relatively narrow range, while its interest expense increased significantly.
| Financial year | Revenue | Interest expense | Net income attributable to Verizon |
| 2022 | $136.8bn | $3.6bn | $21.3bn |
| 2023 | $134.0bn | $5.5bn | $11.6bn |
| 2024 | $134.8bn | $6.6bn | $17.5bn |
| 2025 | $138.2bn | $6.7bn | $17.2bn |
The reasons behind the increase in interest expense differed from year to year. In 2023, higher borrowing costs were the main driver, with the average interest rate on Verizon’s debt rising from 3.7% to 4.9%.
In 2024, a significant factor was a reduction in capitalised interest. While Verizon was preparing its newly acquired spectrum licences for use, some borrowing costs were included in the value of those assets rather than recognised immediately as expenses. As the licences entered service, more of those costs appeared as interest expense. By 2025, interest expense had remained relatively stable.
Net income followed a different pattern. It fell sharply in 2023 before recovering in 2024, despite interest expense continuing to rise. This demonstrates that borrowing costs are only one factor affecting profitability. In 2023, Verizon also recorded a $5.8 billion goodwill impairment charge in its Business division, reflecting a reduction in the recorded value of that business.
Verizon’s debt position has also changed. Total debt increased from $144.0 billion at the end of 2024 to $158.2 billion at the end of 2025. Following its acquisition of Frontier on 20 January 2026, Verizon assumed approximately $12.9 billion of Frontier’s debt and had repaid around $12.4 billion by 30 June 2026.
The chart below provides a longer-term view of Verizon’s profitability and financing costs, comparing annual net income with interest expense between 2019 and 2025.
Verizon Annual Net Income and Interest Expense, 2019-2025
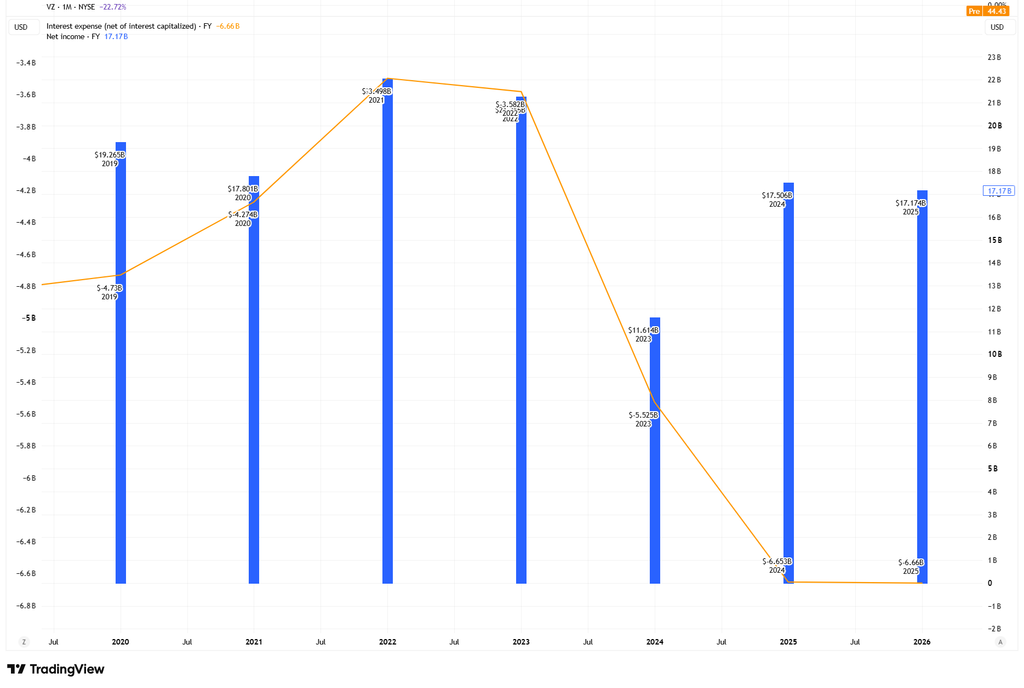
Source & Methodology: TradingView. The chart compares Verizon’s annual net income attributable to Verizon and standardised interest expense, net of interest capitalised, for the financial years 2019 to 2025.
Verizon presents net income in US dollars, in billions, as blue columns on the right axis. The orange line on the left axis shows interest expense in billions of US dollars.The company deducts interest expense from income, which makes it appear as a negative value. A downward movement in the orange line therefore represents a higher interest expense. Verizon labels annual figures by its financial year.The chart plots each column at the end of its financial year, so the FY2025 column appears above 2026 label. TradingView’s standardised financial data may differ from figures reported directly in Verizon’s filings because of provider methodology and classification. Net income attributable to Verizon excludes amounts attributable to non-controlling interests and may therefore differ from Verizon’s consolidated headline figure. Historical figures may also be revised.
Bottom Line
Interest expense shows how borrowing costs affect company profitability. When financing costs rise faster than operating earnings, less profit remains after interest, even if revenue is stable.
However, higher interest expense does not automatically signal financial difficulty. Understanding why a company borrowed, when its debt matures and whether its earnings and cash flow can support those obligations provides a more complete picture of its financial position.