

Equal Highs Explained: When Price Reaches a Similar Level Twice


When price reaches the same area twice, traders often take notice. Traders call two peaks forming at roughly the same level equal highs, a price action pattern helping identify resistance.
But similar highs do not necessarily mean a reversal is coming. They show where upward movement has previously stalled, making the surrounding price structure important when interpreting what happens next.
Understanding how equal highs form, how they differ from a double top and what they reveal about price behaviour can help traders read market structure more effectively.
What Are Equal Highs?
Equal highs form when price reaches two separate peaks at the same or a similar level, with a pullback between them.
A peak is a local high where price rises above nearby trading periods before moving lower. The pullback separates the peaks into two distinct visits to approximately the same price area. Two neighbouring candles with similar highs may not demonstrate this relationship clearly.
As with other candlestick patterns traders compare the highest recorded prices, including candlestick wicks, rather than closing prices alone. The wick represents the highest or lowest price reached during a trading period, while the candle body shows the opening and closing prices.
Importantly, the two highs do not need to match exactly. The term equal generally refers to approximate similarity rather than identical prices.
There is no universal tolerance that applies across every instrument or timeframe. We should compare the difference between the peaks against the market’s typical price movements and the surrounding chart structure.
Why Do They Matter?
An earlier high provides a reference point when price returns towards the same area. When upward movement pauses near that level for a second time, traders may interpret the region as potential resistance.
Resistance refers to an area where upward price movement may encounter difficulty. It is identified through previous price behaviour rather than representing a fixed barrier that price cannot cross.
he significance of two similar highs lies in the repeated interaction with the same price area. Analysing price action around these levels can help traders assess how price behaves when the area is tested again.
However, the chart alone cannot confirm which market participants or outstanding orders are responsible for the price movement.
How to Identify Equal Highs on a Chart
Consider a hypothetical example in which an instrument rises to $100, pulls back and later advances to $100.20.
Although the second peak is slightly higher, the two highs may still represent a similar price area.
Whether the difference is meaningful depends on the instrument and its typical movements. A $0.20 difference may be relatively small in a volatile market but significant within a much narrower trading range.
When assessing equal highs, traders should consider several factors:
- Distinct peaks: Price should form two identifiable highs separated by a pullback, rather than simply recording similar highs on neighbouring candles.
- Price proximity: The highs should be reasonably close relative to the instrument’s usual price movements.
- Timeframe: The pattern should be assessed consistently on the same chart timeframe.
- Market structure: The surrounding trend, pullback and subsequent price action help establish the context.
It is also important to compare prices using the same instrument, data feed and session settings. Different providers or trading sessions may record slightly different highs.
Chart scaling can affect how closely the peaks appear to align, so traders should check the recorded prices rather than relying entirely on visual appearance.
Completed candles provide a more stable reference because an unfinished candle can continue forming new highs before the trading period ends.
Equal Highs vs Double Top: What’s the Difference?
Both equal highs and double tops may resemble each other, yet they describe different aspects of price behaviour.
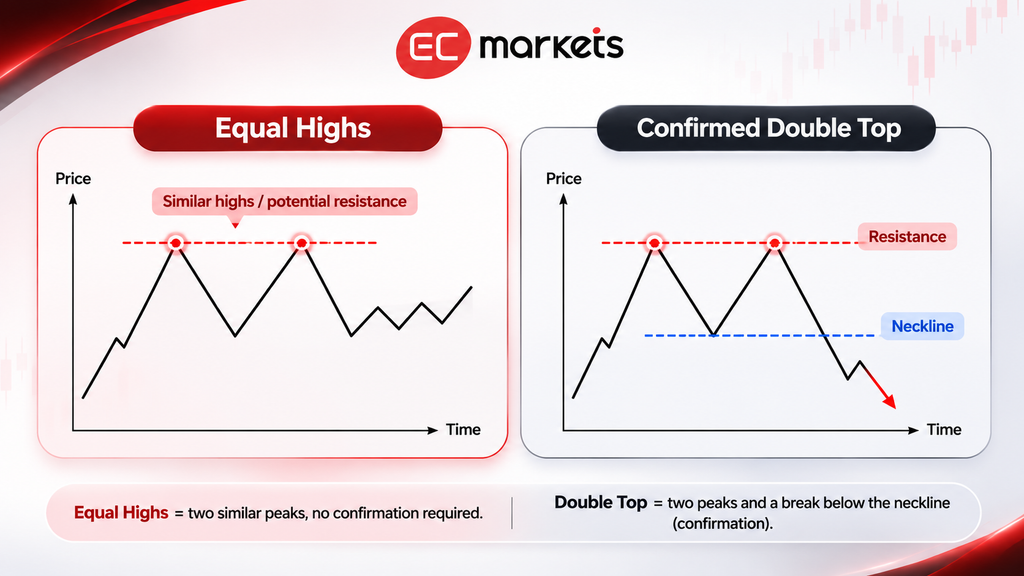
Equal highs refer to two distinct price peaks at approximately the same level, separated by a pullback. Their identification does not require price to move in a particular direction afterwards.
A double top chart pattern is a potential bearish reversal pattern involving two peaks and an intervening low, commonly referred to as the neckline.
In traditional technical analysis, a subsequent move below the neckline is generally used to confirm the double top pattern. Even then, confirmation does not guarantee that a sustained downward movement will follow.
The key distinction is that equal highs describe a relationship between two price peaks, while a confirmed double top involves an additional breakdown below the intervening low.
This is why two similar highs should not automatically be interpreted as evidence of an approaching bearish reversal.
A Chart Pattern Comparison: Equal Highs vs Double Top
A Real-World Example: Identifying Similar Price Peaks in Gold
Gold provides a practical example of how two peaks can form near a similar price level without matching exactly.
Gold Price Analysis: XAU/USD Daily Chart
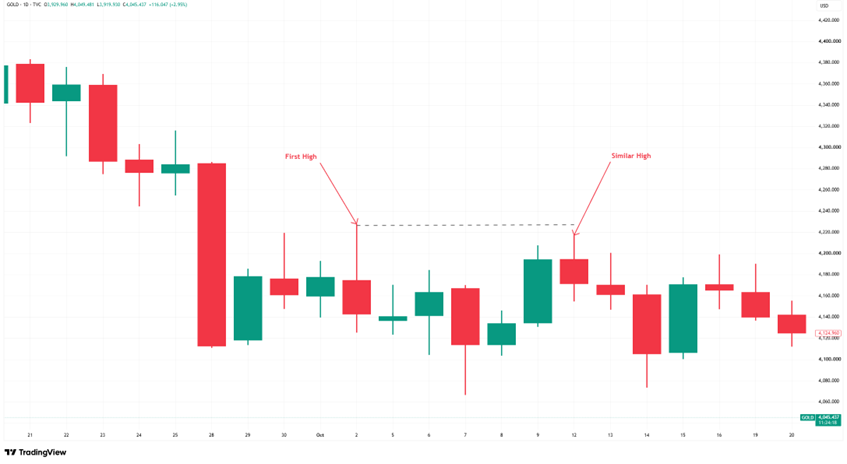
Source: TradingView. XAU/USD daily chart. Data captured on 4 November 2026; chart window ends 20 October 2026. Past performance is not a reliable indicator of future performance.
The first labelled high appears on 2 October 2026, above the nearby high recorded on 30 September. Price subsequently moves lower before recovering towards a similar area on 12 October.
The second labelled peak is slightly below the first, demonstrating how two highs can be considered approximately equal without reaching identical prices.
The intervening pullback is important because it separates the peaks into two distinct upward movements rather than a single period of consolidation.
Together, the highs identify an area where upward progress paused on separate occasions. The example illustrates how traders can recognise this relationship on a live market chart while considering the wider price structure.
The pattern itself does not establish why price paused or determine whether the next significant movement will be higher or lower.
The Limitations
Although equal highs can provide a useful reference area, their identification involves some judgement.
Two traders examining different timeframes or using different data feeds may identify slightly different peaks. The surrounding market structure can also influence whether the highs appear significant.
Similar peaks may develop during an uptrend, a sideways market or a broader downward movement. Their appearance alone does not establish that the prevailing trend is about to change.
Price may subsequently move above the area, turn lower or continue fluctuating around it. A move above the previous highs does not necessarily confirm a sustained breakout, just as another rejection does not guarantee a reversal.
For a more complete interpretation, traders should consider the pattern alongside surrounding candlesticks, support and resistance levels and the wider trend.
Bottom Line
Equal highs form when price reaches approximately the same level on two separate occasions, with a pullback between the peaks. They can help traders identify areas where upward movement has previously encountered resistance.
However, the pattern alone does not confirm a reversal. Its significance depends on the surrounding price structure, the timeframe and how price subsequently behaves around the area.
For traders, equal highs are best understood as a reference point for analysing price action rather than a standalone trading signal.