
The Form Guide: What Liverpool's Last Six Games Can Teach Traders About Candlestick Charts


Ahead of Liverpool vs Arsenal at Anfield, we examine Liverpool’s last six games for traders. Moreover, how it can teach traders how to read candlestick charts and recognise market momentum.
Table of Contents
- 1. A Green Candle Doesn't Tell the Whole Story
- 2. One Red Candle Doesn't Mean the Trend Is Over
- 3. Winning Momentum. But How Strong Is the Trend?
- 4. The Same Pattern Can Tell Different Stories on Different Timeframes
- 5. Recognising a Pattern Is Only the Beginning
- Liverpool vs Arsenal: The Next Candle Hasn't Formed Yet
- Bottom Line
Four wins, one penalty-shootout victory and a 3-0 defeat.
Liverpool head into Sunday’s Premier League clash with Arsenal at Anfield having recovered from a difficult defeat against Manchester City. Their latest result? A tense 1-1 draw against Chelsea, followed by a 6-5 penalty-shootout victory to secure a place in the EFL Cup quarter-finals.
But look beyond the results, and the picture becomes more interesting.
Liverpool have scored six against LASK, come from behind to beat Villarreal, kept a clean sheet against Brighton and needed penalties to overcome Chelsea. The outcomes have largely been positive, but the performances behind them tell different stories.
Now consider a trading chart.
A series of green candlesticks might suggest buyers are in control. But is the trend strengthening? Could momentum already be fading? And does one large red candle mean the direction has changed?
That’s where football form guides and candlestick charts have something in common. The result is only the beginning of the analysis.
1. A Green Candle Doesn’t Tell the Whole Story
Liverpool’s 4-3 victory over Villarreal on 20 October looked like another positive result in their recent run.
But the scoreline alone doesn’t reveal that Liverpool had fallen 2-0 behind before recovering to win.
The final outcome was positive. The journey was anything but straightforward.
Against Chelsea, the story was different again. Liverpool progressed to the next round, but the match finished 1-1 after 90 minutes, with the tie ultimately decided on penalties.
Two positive outcomes. Two very different performances.
In trading, a similar distinction exists between where a price finishes and how it moved to get there.
Every candlestick contains four important pieces of information:
- Open: The price at the beginning of the period.
- High: The highest price reached.
- Low: The lowest price reached.
- Close: The price at the end of the period.
The candle’s body shows the difference between its opening and closing prices, while its wicks reveal the highest and lowest levels reached during that period.
But just as a football scoreline doesn’t tell the full story of a match, a closing price doesn’t reveal everything that happened during a trading session.
Consider two bullish candles.

Both candles are green. Yet the balance between buyers and sellers may be very different.
The trading lesson:
Don’t judge a candle by its colour alone. Examine its body, wicks and position within the wider chart to understand the price action behind it.
For a closer look at these formations, explore our guide to the basics of candlestick patterns.
2. One Red Candle Doesn’t Mean the Trend Is Over
On 11 October, Liverpool suffered a 3-0 defeat against Manchester City.
It was a significant setback. But what followed tells a different story.
Liverpool responded with victories against LASK, Brentford, Villarreal and Brighton before progressing past Chelsea on penalties.
One disappointing result hadn’t defined their next five matches.
Financial markets present a similar challenge.
Imagine an asset has been rising steadily for several sessions. Then, suddenly, a large bearish candle appears.
Is the uptrend over? Are sellers taking control? Or is this simply a temporary pullback?
The candle itself cannot answer those questions.
Prices rarely move in straight lines. Even established uptrends experience periods of consolidation, short-term declines and occasional sharp corrections.
That’s why traders examine the wider market structure before interpreting a single move as a reversal.
For example, they might look at whether:
- Price continues to form higher highs and higher lows.
- An established support level is holding.
- Selling pressure is accompanied by unusually high trading volume, where reliable volume data is available.
- Subsequent candles confirm the decline or show buyers returning.
A sharp bearish candle can signal a potential change in sentiment. But without further evidence, it may be too early to conclude that the broader trend has reversed.
The trading lesson:
One red candle can be a warning, but it isn’t proof of a reversal. Look for confirmation from the surrounding price action before drawing conclusions.
3. Winning Momentum. But How Strong Is the Trend?
Liverpool’s latest five matches have all ended with a positive outcome, including their progression against Chelsea.
But the results haven’t been equally convincing.
They scored six against LASK, conceded three against Villarreal, kept a clean sheet against Brighton and needed a penalty shootout to overcome Chelsea.
The direction of their recent form looks positive. The strength of the performances, however, has varied.
Traders face a similar challenge when analysing market momentum.
Imagine a currency pair closes higher for four consecutive trading sessions.
At first glance, the trend looks strong.
But consider two possible scenarios.
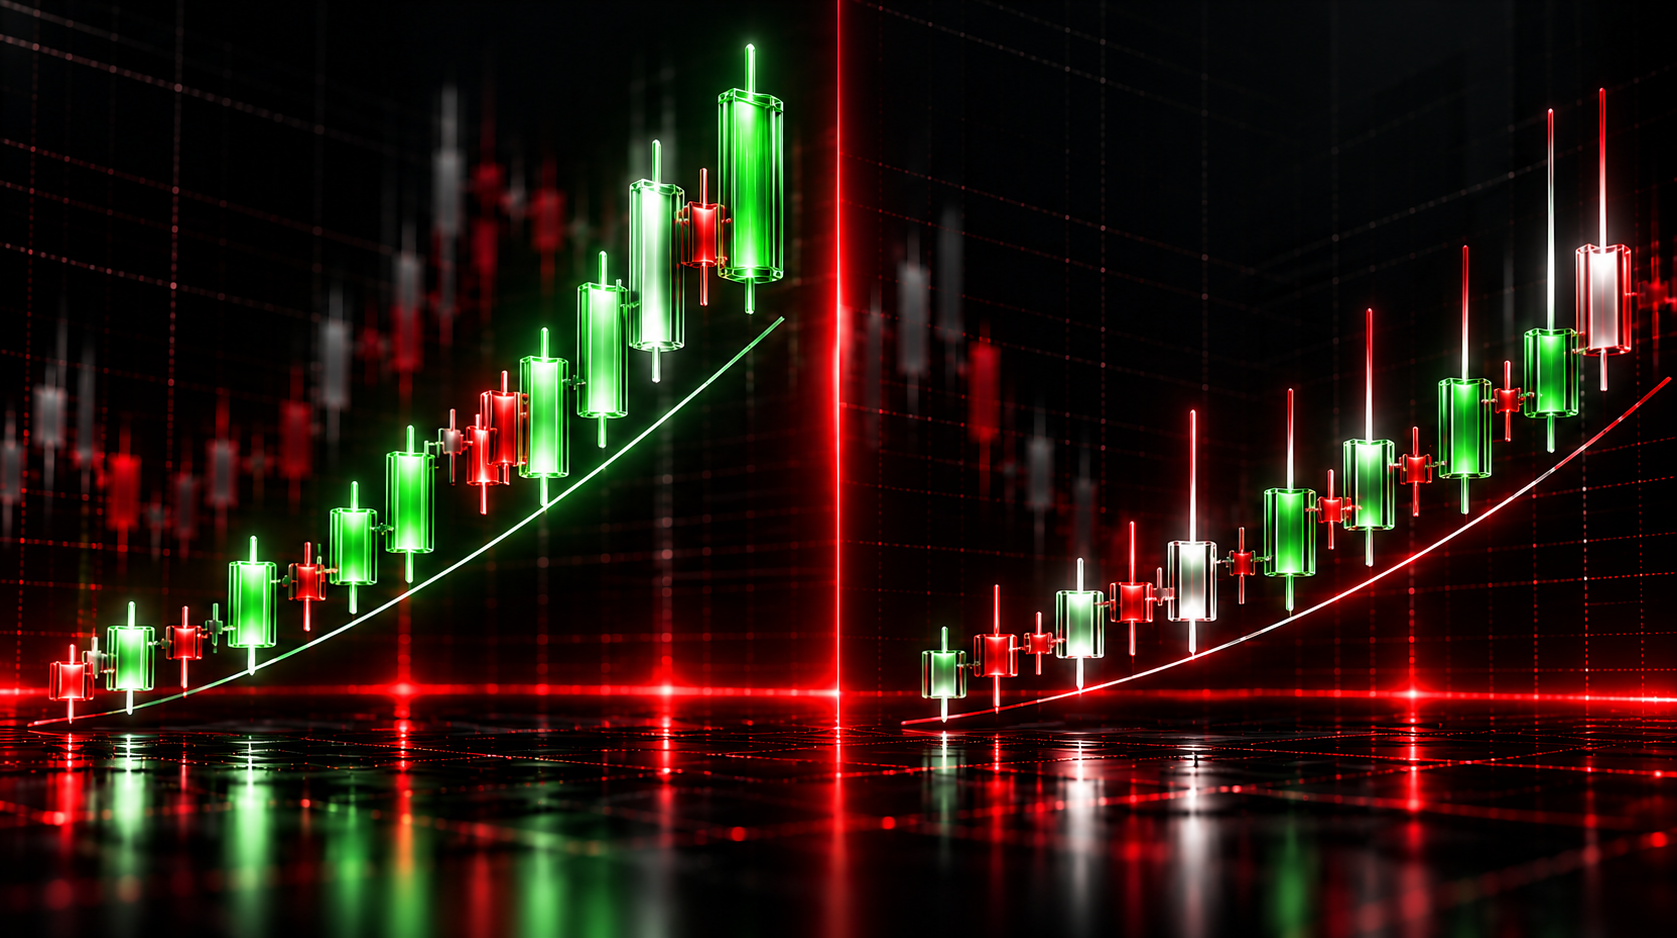
Scenario A: Strengthening Momentum
Each bullish candle has a relatively large body, closes near its high and pushes beyond the previous session’s price range.
This can suggest sustained buying pressure, with buyers continuing to drive prices higher.
Scenario B: Weakening Momentum
Each candle closes slightly higher, but the bodies become progressively smaller and the upper wicks grow longer.
Prices are still rising, yet buyers may be finding it increasingly difficult to sustain the move.
The direction is the same. The underlying price action is different.
This is why traders don’t simply count bullish and bearish candles.
They examine candle size, closing position, price structure and, where relevant, trading volume and momentum indicators to assess the strength behind a move.
A sequence of green candles can indicate an upward trend, but it doesn’t guarantee that buying pressure will continue.
The trading lesson:
Trend direction and momentum strength are not the same thing. Understanding the difference can help traders recognise when a move is gaining strength or showing signs of exhaustion.
4. The Same Pattern Can Tell Different Stories on Different Timeframes
Liverpool’s recent form includes Premier League, Champions League and EFL Cup fixtures.
Across all competitions, their latest results suggest improving momentum.
But Sunday’s match against Arsenal is a Premier League fixture. Looking exclusively at Liverpool’s domestic league performances could provide a different perspective.
Neither view is necessarily wrong. They simply answer different questions.
The same principle applies to technical analysis.
Imagine EUR/USD is moving higher on a 15-minute chart.
A trader focusing exclusively on that timeframe might see several bullish candles and conclude that the market is trending upwards.
But switch to the daily chart, and those gains might represent a short-term recovery within a broader downtrend.
Both observations can be correct.
The difference is the timeframe.

This is why traders often use multi-timeframe analysis to understand how shorter-term price movements fit within the bigger market picture.
A common approach involves examining three levels:
- Higher timeframe: Identify the broader trend and significant support or resistance zones.
- Intermediate timeframe: Assess the current market structure and developing price patterns.
- Lower timeframe: Examine more detailed price action and potential entry or exit opportunities.
The goal isn’t to find a chart that confirms an existing opinion. It’s to understand whether signals across different timeframes support or contradict one another.
The trading lesson:
A bullish signal on a shorter timeframe can look very different when viewed against the broader market trend. Always consider the bigger picture.
5. Recognising a Pattern Is Only the Beginning
Liverpool’s recent results provide an interesting form guide ahead of Arsenal’s visit.
But five positive outcomes don’t guarantee a sixth.
Arsenal will present a new challenge, with different tactical demands and circumstances. Liverpool’s previous performances offer useful context, but they cannot determine Sunday’s result.
Candlestick patterns work in much the same way.
A bullish engulfing pattern, hammer or doji can highlight a potential change in market sentiment.
But recognising the formation is only the first step.
Consider a hammer candlestick.
When it appears after a sustained decline and near an established support level, traders may interpret it as a sign that selling pressure is weakening and buyers are beginning to respond.
But the same candle appearing in the middle of a sideways market may carry much less significance.
Its shape hasn’t changed. Its context has.
That’s why traders often look for additional confirmation before acting on a pattern.
This might include:
- A subsequent candle supporting the initial signal.
- A break above or below an important price level.
- Alignment with the broader market trend.
- Supporting evidence from volume or other technical indicators.
Even when several signals align, the market can still move in the opposite direction.
That’s where risk management becomes essential.
A trading plan should account not only for what might happen if the analysis proves correct, but also for what happens if it doesn’t.
The trading lesson:
Candlestick patterns are tools for interpreting price behaviour, not guarantees of future direction. Context, confirmation and risk management matter more than recognising a formation in isolation.
Liverpool vs Arsenal: The Next Candle Hasn’t Formed Yet
When Liverpool welcome Arsenal to Anfield on Sunday, 1 November, their latest six matches will offer plenty to examine.
The Manchester City defeat raised questions. The Villarreal comeback demonstrated resilience. The Brighton victory delivered a clean sheet, while the Chelsea shootout showed that a positive outcome can still follow a difficult contest.
Each result adds information to the form guide.
But none can tell us exactly what happens next.
The same is true of financial markets.
Historical price action helps traders identify trends, assess momentum and recognise potential changes in buying or selling pressure. What it cannot do is reveal the next candle with certainty.
That’s why effective technical analysis goes beyond recognising familiar formations. It requires understanding the broader trend, evaluating the strength of a move, waiting for confirmation where appropriate and managing the risk of being wrong.
Bottom Line
Don’t trade the colour. Read the candle.
A green candle tells you that prices closed higher than they opened. It doesn’t tell you whether buyers remained in control throughout the session, whether momentum is fading or whether the next move will follow the same direction.
That’s what the rest of the chart is for.
And just as Liverpool’s last six results can’t predict Sunday’s outcome against Arsenal, a sequence of bullish candles can’t guarantee the next move in the markets.
Read the price action. Understand the context. Manage the risk.
This article is provided for educational purposes only and does not constitute investment advice.