
What Gross Margin Tells Investors About a Company


Revenue shows how much money a company generates from sales, but it does not reveal how much remains after the direct costs of delivering those sales. Gross margin helps bridge that gap, showing the proportion of revenue retained as gross profit.
Changes in gross margin can reveal whether a company is retaining more or less from its sales, even when revenue is growing.
Understanding what drives those changes can help investors assess pricing, cost pressures and the composition of a company’s sales.
What Is Gross Profit?
Gross profit is revenue minus the direct cost of producing or purchasing the goods and services sold by a company. These direct expenses are usually reported as cost of sales or cost of goods sold.
Consider a company that generates $100 million in revenue and records $60 million in cost of sales. Its gross profit is $40 million.
Gross profit is not the company’s final profit. Expenses such as marketing, administration, research, interest and taxes have not yet been deducted.
What Is Gross Margin and How Is It Calculated?
It expresses gross profit as a percentage of revenue.
Gross Margin (%) = (Gross Profit ÷ Revenue) × 100
In the example, the company earns $40 million in gross profit from $100 million in revenue. Its gross margin is therefore 40%.
This means that the company retains 40 cents of gross profit from every $1 of revenue before deducting its other operating expenses.
Gross margin differs from operating margin and net profit margin because it does not account for all the expenses involved in running and financing a business. Understanding other financial ratios can help investors assess profitability alongside valuation and financial strength.
This is a simplified hypothetical example for educational purposes only and does not represent an actual company.
Why Gross Margin Can Increase
The percentage may rise when a company increases prices without experiencing an equivalent rise in production costs.
Lower raw material, transportation or manufacturing costs can also improve the margin. Greater efficiency may allow the company to produce each item at a lower cost.
Product mix can also influence the result. Product mix refers to the combination of products a company sells. If higher margin products form a larger proportion of sales, the overall gross margin may increase.
A company may also benefit from reduced discounting, better inventory management or a greater proportion of direct sales.
An improving gross margin suggests that the company is retaining more from each sale. However, the reason for the improvement matters. A temporary decline in freight or material costs may not produce a lasting change.
Why Gross Margin Can Decline
The margin may fall when production or purchasing costs increase faster than selling prices.
Heavier discounts can also place pressure on the margin. A company may reduce prices to attract customers or clear products that have not sold as expected.
Inventory can become outdated or less desirable. The company may then record an inventory obsolescence reserve. This is an amount recognised when management expects that some products may need to be sold for less than originally expected or may not be sold at all.
Gross margin may also decline when customers move towards cheaper products or lower margin products become a larger share of sales.
A decline is not always evidence of permanent business weakness. A company may temporarily accept a lower margin to clear old inventory, enter a new market or attract new customers.
Nike: Revenue and Gross Margin
Nike provides a useful example of how changes in pricing, production costs, discounting and sales channels can affect gross margin, even when revenue moves in a different direction.
Between fiscal 2020 and 2022, Nike’s reported revenue increased from $37.4 billion to $46.7 billion, while gross margin rose from 43.4% to 46.0%. Nike attributed the margin improvement in fiscal 2022 partly to a greater proportion of full-price sales, stronger Nike Direct margins and favourable currency movements, despite higher freight and logistics costs.
However, revenue growth did not always translate into stronger margins. In fiscal 2023, revenue increased to $51.2 billion, but the margin declined to 43.5%. Higher product input costs, freight expenses, discounting and unfavourable currency movements placed pressure on the margin.
Gross margin recovered to 44.6% in fiscal 2024, supported by strategic pricing and lower ocean freight and logistics costs. The following year, revenue declined to $46.3 billion and gross margin fell to 42.7%, reflecting higher discounts, changes in sales channel mix and increased inventory obsolescence reserves.
In fiscal 2026, revenue remained broadly unchanged at $46.4 billion, while gross margin improved slightly to 42.9%. However, the margin remained below its fiscal 2024 level.
The figures illustrate why investors should look beyond revenue growth. Higher sales do not necessarily mean a company is retaining more gross profit from each dollar of revenue. Understanding the reasons behind these changes is an important part of fundamental analysis.
Nike Annual Revenue and Standardised Gross Margin, 2020 to 2026
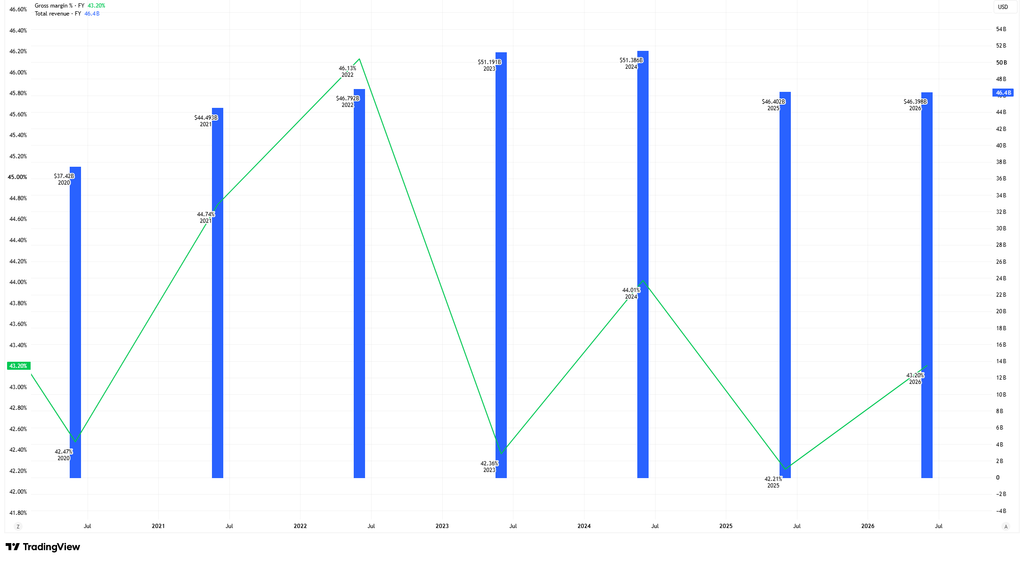
Source & Methodology: TradingView. The chart compares Nike’s annual total revenue and standardised gm for the financial years 2020 to 2026. The chart shows Nike’s total revenue in US dollars, in billions, as blue columns on the right axis. Standardised gm is shown as a percentage using the green line on the left axis. Annual figures are labelled by Nike’s financial year, which ends on 31 May. The chart places each observation at year end, so the calendar position may not align with the year label. TradingView’s standardised financial data may differ from figures reported directly in Nike’s filings because of provider methodology and classification. Researchers may revise historical figures. Past performance is not a reliable indicator of future performance. Data as of 3 November 2026.
The TradingView chart shows that Nike’s standardised revenue and gross margin did not consistently move in the same direction between fiscal 2020 and 2026. Revenue increased during parts of the period even as gross margin declined, illustrating how changes in costs, discounting and sales mix can affect the proportion of revenue retained as gross profit.
The standardised figures differ from Nike’s company-reported results because of differences in data-provider methodology and classification.
What Should Investors Look for When Comparing Gross Margins?
This measure is most useful when examined over several reporting periods and alongside other financial measures.
Investors may consider whether a margin change reflects a lasting shift in pricing or production efficiency, or a temporary factor such as freight costs or inventory adjustments.
Comparisons between companies also require care. Gross margins can vary considerably across industries because businesses have different cost structures, products and accounting practices.
A higher gross margin does not necessarily mean a company is more profitable overall. Operating expenses, debt costs, taxes and cash flow can materially affect its financial position.
Looking at these factors together, including the relationship between earnings and cash flow, provides a more complete picture.
Bottom Line
Gross margin shows how much gross profit a company retains from revenue after accounting for the direct costs of its sales.
Changes in the margin can reveal shifts in pricing, production costs, discounting and product mix. As Nike’s results demonstrate, revenue growth and profitability measures do not always move together.
For investors, the important question is not simply whether gross margin has risen or fallen, but why. Understanding the underlying drivers, alongside operating expenses, cash flow and wider financial performance, provides a more meaningful assessment of a company’s profitability.