














Nasdaq 100 vs Bitcoin: Are They Moving Together?


Bitcoin and the Nasdaq 100 are often grouped together as risk assets because both are influenced by investor sentiment, interest rates and market liquidity. However, their relationship is far from constant. Comparing their relative performance can help traders understand shifts in market leadership, risk appetite and broader macroeconomic conditions.
Different Assets, Shared Sensitivities
Despite often being compared by traders, Bitcoin and the Nasdaq 100 are fundamentally different markets. Bitcoin is a decentralised digital asset supported by a peer-to-peer network, while the Nasdaq 100 tracks 100 of the largest non-financial companies listed on the Nasdaq Stock Market. Although the index includes companies from several industries, it remains heavily influenced by large technology and growth businesses.
Despite these structural differences, traders often compare the two markets because both can react strongly to changes in global investor confidence, interest rate expectations and macroeconomic liquidity, meaning the amount of capital readily available to move through financial markets.
Research from the International Monetary Fund indicates that crypto assets became more closely connected with equity markets after 2020, particularly as institutional participation increased. However, this relationship is not permanent. It can strengthen or weaken considerably as market conditions and macroeconomic regimes change.
What the Bitcoin vs Nasdaq 100 Chart Shows
This daily chart covers approximately one year, from August 2025 to August 2026. The upper panel compares the percentage performance of Bitcoin and the Nasdaq 100 from the same starting point.
During this period, the two markets did not maintain a consistent performance relationship. Although there were shorter periods when both moved in a similar direction, the broader picture was one of substantial divergence.
The Nasdaq 100 gained approximately 29.2%, while Bitcoin declined by around 43.9%. The Nasdaq maintained a broadly rising structure, while Bitcoin experienced larger price swings and remained under sustained selling pressure.
The middle panel makes this performance gap even clearer. It displays a relative strength ratio calculated by dividing the BTC/USD price by the Nasdaq 100 index level.
Because the two markets are quoted in different units, the absolute value of the ratio is less important than its direction and percentage change. A rising ratio indicates that Bitcoin is outperforming the Nasdaq 100, while a falling ratio indicates that the Nasdaq 100 is outperforming Bitcoin.
The ratio declined by approximately 56.6% across the selected period, confirming persistent Nasdaq leadership rather than a temporary difference in performance.
Bitcoin vs Nasdaq 100 Performance, Relative Strength and RSI
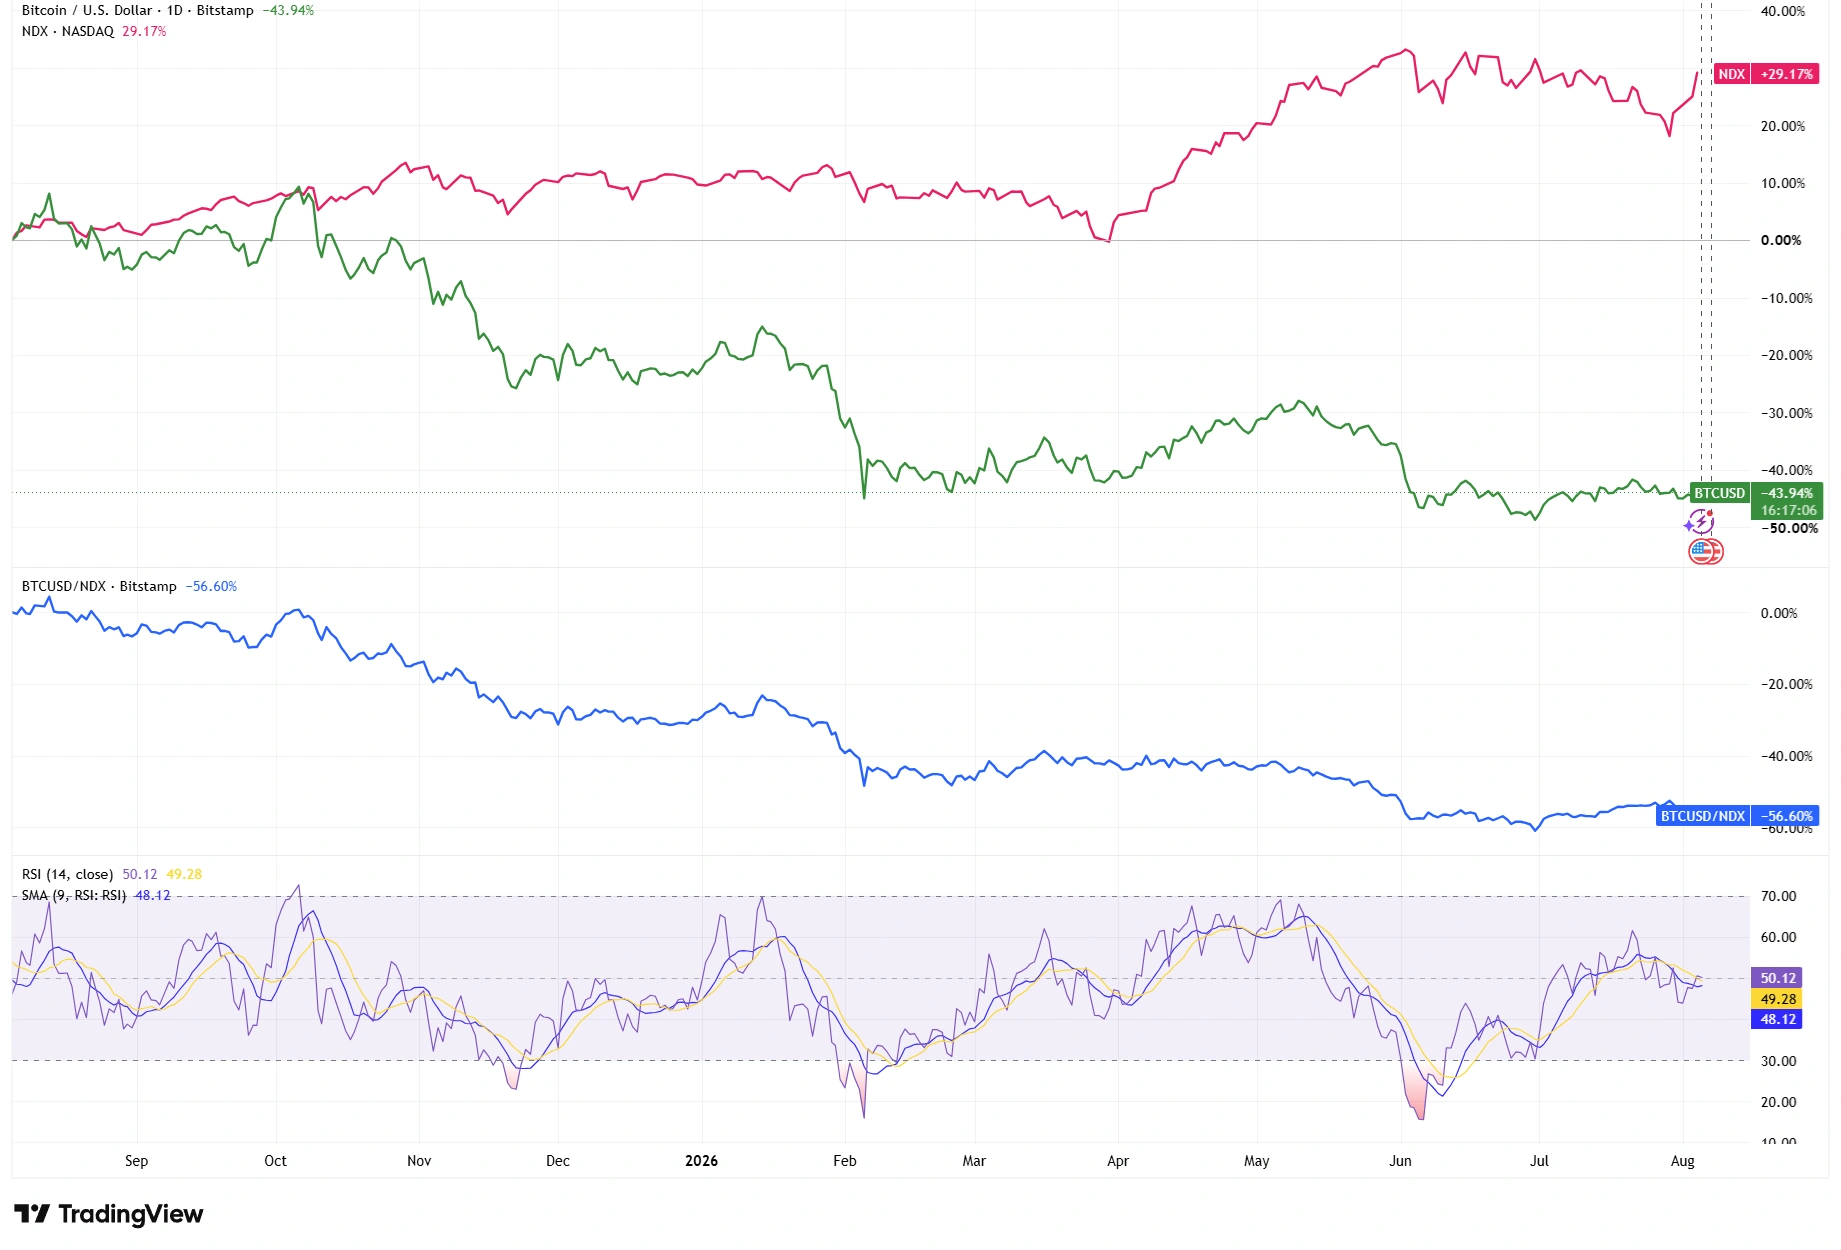
Source & Methodology: TradingView. The BTC/USD to Nasdaq 100 ratio is calculated by dividing the Bitcoin price by the Nasdaq 100 index level to show relative performance, with a rising ratio indicating Bitcoin outperformance and a falling ratio indicating Nasdaq 100 outperformance. The lower panel displays the standard 14-period Relative Strength Index (RSI) together with its 9-period simple moving average. Data accurate as of 5 August 2026. Past performance is not a reliable indicator of future performance.
Reading the Bitcoin vs Nasdaq 100 RSI
The lower panel shows the 14-period Relative Strength Index, together with its 9-period simple moving average.
The RSI measures the speed and strength of recent price movements on a scale from zero to 100. Readings above 70 are commonly associated with overbought conditions, while readings below 30 are often associated with oversold conditions.
At the end of the selected period, the RSI is close to 50.1, while its moving average is near 49.3. These readings indicate broadly neutral momentum, with neither a pronounced overbought nor oversold condition present.
Bottom Line
Comparing the relative performance of Bitcoin and the Nasdaq 100 can provide traders with useful insight into global risk appetite, market liquidity and changing asset leadership.
However, the selected chart demonstrates why traders should not assume that the two markets will always move together.
During this twelve-month period, strong Nasdaq performance coincided with substantial and prolonged Bitcoin underperformance. The declining BTC-to-Nasdaq ratio confirmed that the difference was not limited to a brief period of volatility but reflected a broader relative performance trend.
Neither correlation nor divergence should be treated as a standalone trading signal.
A more complete market assessment may combine price structure, relative strength, moving averages, momentum indicators, monetary conditions and asset specific fundamental developments.
Technical analysis is generally most useful when several independent forms of evidence support the same interpretation.