How to Read Forex Charts

Are you new to trading and wondering where to even begin? Well, one special first skill to master is understanding how to read forex charts. These charts are the foundation of all forex trading strategies and in this course we are going to break it down one of the questions that all traders ask, 'how do you read forex charts?', so you can feel confident in how to read currency trading charts. Let’s get started!
How to read Forex Charts: What are Forex Charts and why do they matter?
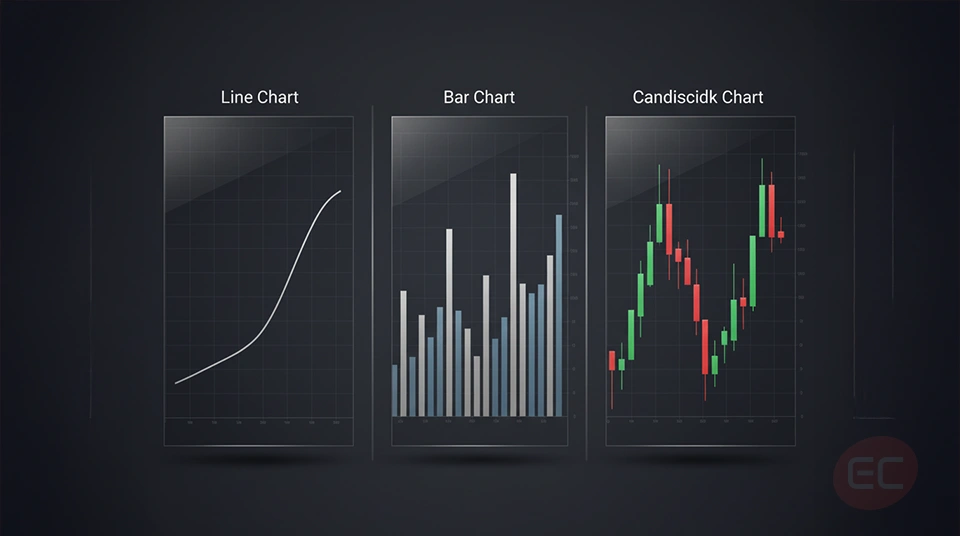
Before we tackle exactly how to read currency trading charts, first things first, what are forex charts? Forex charts are visual representations of exchange rates between two currencies over a specific period of time. They are used to help traders analyse market trends and spot opportunities in the market. There are different types of charts, and before learning how to read forex charts, let’s first understand the different types.
1. Line Chart: When new traders ask "how do you read forex charts with just a single line?", the answer is: by focusing on the simplicity. Line charts are the simplest type of forex chart, it connects the closing prices of a currency pair over a specific period of time. Let’s explore an example: assuming EUR/USD closes at 1.1000 today and 1.1050 tomorrow, a line would connect these two points. It is a simple story of where prices have been and where they’re going next
2. Bar Charts: If you’ve ever wondered, “how do you read forex charts that use bar formations?”, the key is in the relationship between the opening and closing prices. In comparison to line charts, bar charts show more overall information, such as the opening price, the closing price, high point and low point for each period. In other words, bar charts tell a story: the top of the bar indicates the high point, the bottom of the bar indicates the low point, a horizontal tick on the left indicates the opening price, and a horizontal tick on the right indicates the closing price. When the closing price is higher than the opening, it reflects buying strength; when it’s lower, it shows selling pressure. Understanding what type of trader you are, whether you prefer a simple overview or a detailed overview can help you decide which charts suit you best and how to read forex charts.
3. Candlestick Charts: these are generally the most popular charts amongst traders as they provide the same information as bar charts but they are visually more intuitive. Each candlestick represents the open, high, low, and close price. There are also bullish candles (generally green candles) representing an increase in prices and bearing candles (generally red candles) representing a decrease in prices. When mastering how to read currency trading charts, candlesticks are an absolute game changer to your trading experience! Why? Because they visually indicate market psychology and potential reversals.
Why are line charts so useful? They are crucial to traders as they give a clear view of the overall trend, especially for beginners who are in the process of discovering how to read currency trading charts.
Understanding Currency Pairs in Charts
You cannot fully understand how to read forex charts without first understanding currency pairs. New traders commonly ask “how do you read forex charts when looking at different currency pairs?”. As we’ve seen in our previous courses, each forex chart involves two currencies: the base currency (the first one) and the quote currency (the second one.) If the chart shows that EUR/USD is rising, that would indicate that the euro is strengthening against the dollar. Forex charts can be analysed over a variety of timeframes, including:
- 1 minute
- 5 minutes
- 1 hour
- Daily
- Weekly
- Monthly
Understanding these timeframes is crucial to learning how to read forex charts! Why? Because different strategies rely on different time horizons. For example, a scaler may want to use a 5 minute chart, while a swing trader may want to look at daily charts.
What are Forex Charts: Price Axis and Time Axis
Some key components to focus on when learning how to read currency trading charts are the axis. There are two axis, the price and the time:
1. Price Axis: the vertical axis on the right showing the exchange rate values.
2. Time Axis: the Bottom axis showing the time intervals based on your selected timeframe.
So when learning how to read currency trading charts, ask yourself what timeframe suits your lifestyle the best? Do you prefer trading during the day? Or maybe you prefer to analyse the market at night? Either way, understanding your preferred routine can help shape how to read forex charts effectively.
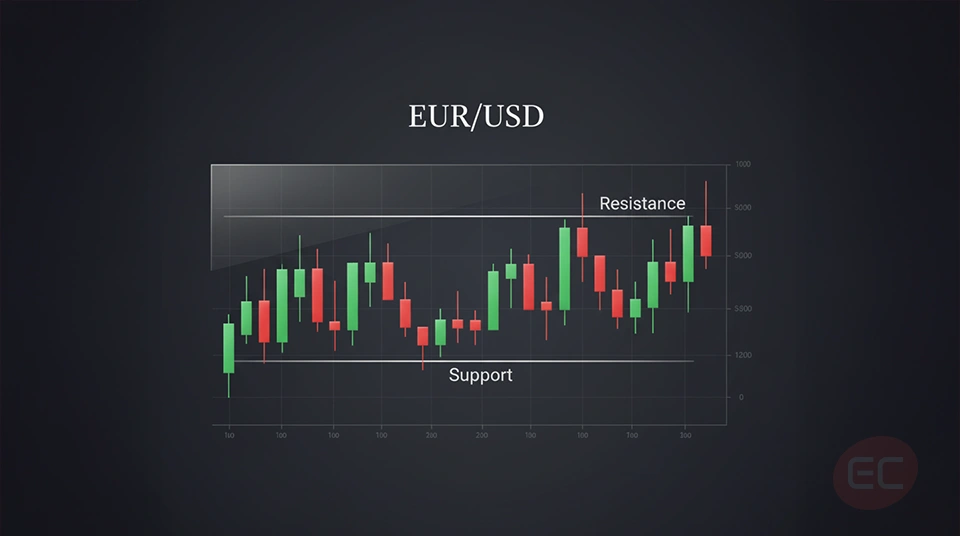
What are Forex Charts: Support and Resistance Levels
As you learn more about how to read forex charts, you will come across the terms ‘support’ and ‘resistance’,
let’s break them down together:
1. Support: it’s the price level where the market tends to stop falling.
2. Resistance: the price level where the market tends to stop rising.
These levels are key to understanding and identifying entry and exit points.
You can even test it out for yourself! All you need to do is open a forex chart (you can use EUR/USD as an example on a platform like MetaTrader. Just spot the areas where the price bounced off consistently, if you’ve spotted it then congrats! You’ve just identified a support or resistance level!

Conclusion: How to read Forex Charts
Learning how to read forex charts may seem overwhelming at first, especially with so many types of charts, indicators, and timeframes, but here’s the truth, every single successful trader you’ve ever heard of started right where you are right now. They opened their first chart, they stared at all those candles, lines, and bars, and they thought, “what does any of this mean?” We’ve all been there! Throughout this guide, you’ve taken an important first step by learning what forex charts are, why they matter, and how to distinguish between line charts, bar charts, and candlestick charts. This is the foundation for understanding how to read currency trading charts. You’ve also discovered how to recognise currency pairs, how timeframes impact your strategy, and why support and resistance levels are the building blocks of any market structure. The next time you catch yourself lost in a chart, pause and ask “how do you read forex charts without emotion?” Remember, data over drama! Zoom out, confirm trends and let data guide your next move.
We hope you enjoyed this course on how to read forex charts! You should by now have a better idea on how to answer the big question 'how do you read forex charts?' and have a strong foundation to start analysing and understanding them for yourself! Keep on reading the EC Markets Academy for more top tips, tricks and tools that will get you from a beginner to expert trader in no time