
Equal Lows Explained: When Price Reaches a Similar Level Twice


What happens when price falls to almost the same level twice? In technical analysis, traders call this formation equal lows, and it can highlight an important area to watch on a chart.
They form when price reaches a low, rebounds and later returns to approximately the same level. These repeated troughs create a visible reference area that traders may interpret as potential support.
However, two similar lows do not necessarily signal a reversal. Understanding how to identify them and what the surrounding price action reveals is essential to interpreting the formation correctly.
What Are Equal Lows?
Equal lows are two distinct price troughs at the same or a similar level, separated by a bounce. A bounce is a movement higher following a decline. The opposite formation, equal highs, involves two similar peaks separated by a pullback.
A trough is a local low where price falls below nearby periods before moving higher. The bounce between the troughs distinguishes two separate visits to a similar price area from one continuous decline. Two neighbouring candles with similar lows may not demonstrate this relationship clearly.
When identifying equal lows, traders compare the lowest recorded prices, including the wick tips, rather than closing prices alone. On a standard candlestick chart, the body connects the opening and closing prices, while the wicks indicate the period’s highest and lowest prices.
Importantly, the lows do not need to match to the final decimal place. The term equal often describes approximate similarity rather than identical prices.
There is no universal tolerance suitable for every instrument and timeframe. The difference between two lows should therefore be assessed against the surrounding price movements and the scale of the chart.
Why Do They Matter?
When price returns to an earlier low, traders can compare how it behaves around that level. If downward movement pauses again, the area may be interpreted as potential support.
The significance lies in the repeated price behaviour. Rather than identifying a single isolated low, traders now have two separate occasions when price reached a similar area before moving higher.
This creates a reference point for analysing subsequent price movements and understanding how the market has behaved around that level.
However, support and resistance are interpretations of historical price behaviour, not fixed barriers. Equal lows highlight an area where downward movement previously paused, but price may still move below it.
A Simple Example
Suppose an instrument falls to $100, rebounds and later declines to $99.80.
Although the two lows differ by $0.20, they may still be considered approximately equal depending on the instrument’s typical price movements and the chart’s scale.
For an instrument that regularly moves several dollars during a session, this difference may be relatively small. In a much narrower trading range, the same difference could be significant.
The important characteristics are that price forms two distinct troughs, a bounce separates them and both lows occur near a similar price area.
This hypothetical example illustrates how they are identified. It does not establish a future price target or confirm that a reversal will follow.
Equal Lows vs Double Bottom: What’s the Difference?
Equal lows may resemble a double-bottom chart pattern, but the two terms are not interchangeable.
A double bottom typically involves two troughs separated by a rebound. The high reached between those troughs becomes an important reference point.
According to CME Group’s explanation of double-bottom patterns, a move above this intervening high is commonly used as confirmation of the formation.
Equal lows, however, simply describe two distinct troughs at approximately the same price. They do not require a subsequent breakout or confirm that an upward reversal has begun.
The distinction is important: two similar lows can exist without a completed double-bottom pattern.
As CME Group also emphasises, chart patterns provide indications rather than absolute rules about future market movements.
Why Context Matters When Identifying Equal Lows
They can appear during downward trends, sideways markets or broader upward movements. Their significance depends partly on the surrounding price action and wider market structure.
For example, two similar lows within a sideways trading range may represent repeated visits to the lower part of that range. In a downward trend, they may instead indicate a temporary pause in declining prices.
The timeframe also matters. Equal lows identified on a daily chart represent a different period of price behaviour from those appearing on an hourly chart.
For consistent comparisons, traders should use the same instrument, timeframe, data feed and session settings.
Chart appearance can also be misleading. Zooming in or adjusting the vertical scale may make two troughs appear closer together or further apart without changing their actual prices. Checking the recorded lows provides a more reliable comparison.
It is also important to use completed candles. An unfinished candle can continue making new lows before its trading period ends, potentially changing the apparent formation.
Equal Lows in Practice: Gold (XAU/USD) Daily Chart
The gold daily chart provides a practical example of how equal lows can form across separate trading sessions.
Example on the Gold Daily Chart
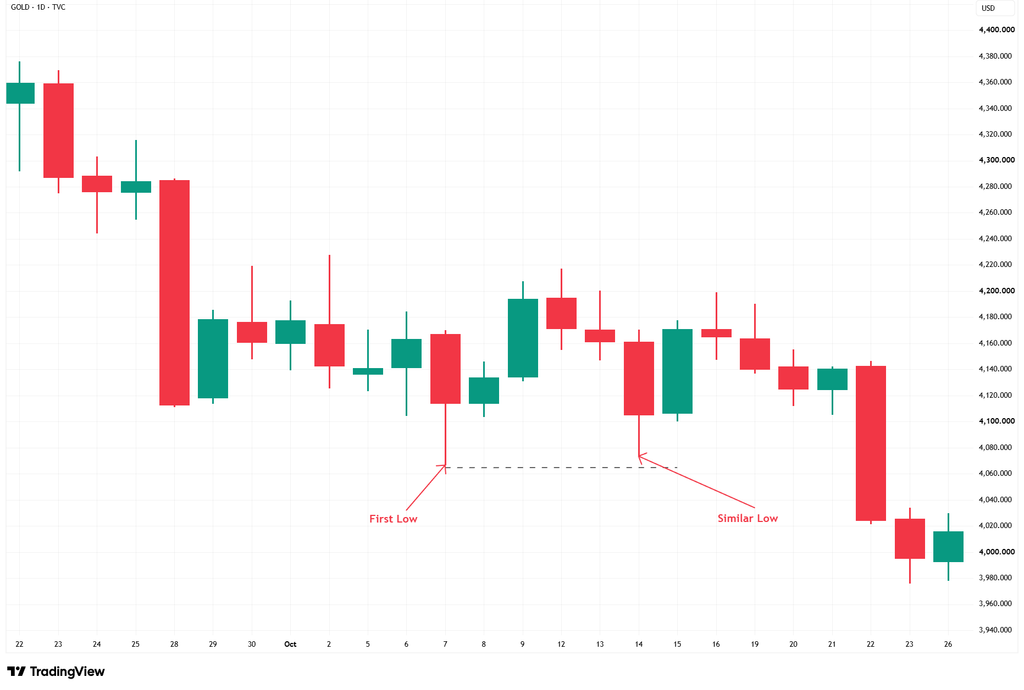
Source: TradingView. Past performance is not a reliable indicator of future performance. Data captured on 18 November 2026; chart window ends 26 October 2026.
The first labelled trough appears on 7 October 2026, when XAU/USD recorded a low below those of the surrounding sessions before rebounding.
The subsequent recovery reached an intervening high on 12 October, separating the first decline from the next move lower.
On 14 October, price formed a second trough slightly above the first. Although the lows were not identical, their proximity created a recognisable reference area.
The dashed guide highlights this approximate alignment and makes the small difference between the two lows visible.
Together, these movements illustrate the three characteristics used to identify equal lows: an initial trough, a separating bounce and a second trough near the earlier price level.
The example demonstrates why traders examine both the recorded lows and the intervening price movement rather than relying on the visual similarity of two candles alone.
Limitations of Equal Lows
Identifying approximately equal lows involves judgement. Different timeframes, data feeds and session definitions may produce different price levels, while chart scaling can influence how closely aligned the troughs appear.
Equal lows also have important analytical limitations.
Two similar lows cannot establish why price paused at a particular level. They do not prove that institutions are buying, that large buy orders remain in the area or that stop orders are positioned below it. Price data alone cannot reveal market participants’ identities, intentions or outstanding orders.
Nor do equal lows guarantee that potential support will hold.
After forming two similar troughs, price may move higher, break below the area or continue fluctuating around it. The formation alone cannot establish the direction, strength or duration of any subsequent move.
For this reason, equal lows are best considered alongside surrounding candlesticks, support and resistance, and wider market structure rather than interpreted in isolation.
Bottom Line
Equal lows form when price reaches two distinct troughs at approximately the same level, separated by a bounce. They create a visible reference area that can help traders understand where downward price movements have previously paused.
The lows do not need to be identical, and their significance depends on the instrument, timeframe and surrounding price action.
While equal lows may indicate an area of potential support, they do not automatically confirm a double bottom or predict an upward reversal. Their value lies in providing context about historical price behaviour, not certainty about what happens next.