
CapEx Explained: Why Big Spending Today Can Shape Profits Tomorrow


Table of Contents
What is CapEx, and how can it explain why a company reports rising profits while generating less free cash flow? The answer lies in how businesses account for their long-term investments.
After companies invest billions in factories, equipment, or technology infrastructure, they recognise the cost gradually over several years, even though the cash leaves immediately. This creates an important distinction between profitability and cash generation.
Understanding how capital expenditure (CapEx) affects financial performance helps investors assess whether a company’s spending is supporting future growth or placing pressure on its cash flow and profit margins.
What Is CapEx?
Capital expenditure, commonly called CapEx, is money a company spends on long-lasting assets that it expects to use for more than one year.
These assets can include factories, machinery, vehicles, computer servers and data centres.
Unlike everyday operating expenses, such as wages and electricity, capex is generally recorded as an asset rather than deducted from profit immediately. We recognize the cost gradually across the assets’ useful lives using depreciation.
This distinction matters because the timing of a company’s cash spending and the recognition of expenses in its financial statements can be very different.
How CapEx Affects Profit and Cash Flow
Consider a company that purchases equipment for $10 million and expects to use it for five years.
Assume the company pays the full amount in cash during the first year and depreciates the equipment evenly over its useful life, with no residual value.
| Financial measure | Amount |
| Equipment purchase | $10 million |
| Initial cash outflow | $10 million |
| Expected useful life | 5 years |
| Annual depreciation | $2 million |
The company spends $10 million in cash when it purchases the equipment. However, instead of recognising the entire amount as an expense immediately, it records $2 million in depreciation each year for five years.
Paying for the equipment affects cash flow, while the expense gradually reduces accounting profit.
This difference is particularly important when analysing free cash flow (FCF).
Analysts commonly calculate free cash flow as cash generated from operating activities minus capital expenditure. It helps investors assess how much cash remains after a business has invested in its assets. Free cash flow is also an important input in discounted cash flow (DCF) analysis, which estimates a company’s value based on expected future cash generation.
A company can therefore report growing profits while its free cash flow declines because it is spending more on equipment, infrastructure or other long-term investments.
Maintenance CapEx vs Growth CapEx
Not all capital expenditure serves the same purpose.
Maintenance CapEx refers to spending needed to maintain or replace existing assets and keep operations running. For example, a manufacturer may replace aging machinery to maintain its current production capacity.
Growth CapEx, on the other hand, involves investing in additional capacity, new technology or expansion into new markets. A technology company building new data centres to support growing demand would be an example.
The distinction matters because maintenance spending may be necessary to sustain operations, while growth spending should support revenue or efficiency.
However, companies do not always report maintenance and growth capex separately. Investors may need to examine management commentary and financial disclosures to understand the purpose of the spending.
Why Do Companies Increase CapEx?
Companies may increase capital expenditure for several reasons, including expanding production capacity, meeting growing demand, replacing aging equipment, adopting new technology or entering new markets.
Higher spending can indicate that management expects stronger demand or sees opportunities to improve the business over time.
For example, a company investing in new production facilities may expect to manufacture more products, while a technology business expanding its computing infrastructure may be preparing to serve more customers.
However, higher CapEx does not guarantee higher returns.
If demand develops more slowly than expected, the company may under use newly acquired assets. The business may still incur depreciation and other operating costs even if the investment has not generated the anticipated revenue.
This explains why investors should consider not only how much a company spends, but also what that spending aims to achieve.
How CapEx Can Affect Profit Margins
Capital expenditure can influence profitability long after the initial investment.
When we put depreciable assets into use, we recognise depreciation expenses over their useful lives. How those assets are used determines whether depreciation goes into the cost of revenue or operating expenses.
This means higher depreciation can affect gross margin, operating margin or both.
Depreciation on machinery used to manufacture products may contribute to the cost of revenue, and the organisation records depreciation on certain administrative assets within operating expenses.
If new investments generate sufficient additional revenue or improve efficiency, they may help offset these costs and support profitability.
However, if revenue grows more slowly than the associated expenses, profit margins may come under pressure.
Free cash flow may show the earlier impact of heavy investment; capital expenditures incur cash payments, causing outflows.
This helps explain why profit growth and cash generation do not always move in the same direction.
Microsoft: How Heavy CapEx Can Affect Free Cash Flow and Margins
Microsoft provides a useful example of how substantial capital expenditure can influence a company’s financial performance.
The business has been spending heavily on data centres, servers and chips to support demand for cloud computing and artificial intelligence (AI).
Microsoft’s financial year ends on 30 June. In this example, capex refers to cash spent on property and equipment.
In fiscal 2022, Microsoft’s capital expenditure was $23.9 billion. By fiscal 2026, it had increased to $115.9 billion, equivalent to approximately 35% of annual revenue.
Yet this substantial increase in spending occurred alongside strong business growth.
In fiscal 2026, revenue rose 18% to $331.8 billion, while net income increased 31% to $133.7 billion.
Free cash flow, however, followed a different path.
After reaching $74.1 billion in fiscal 2024, it declined to $67.0 billion in fiscal 2026.
This contrast illustrates why investors examine cash flow alongside reported profits. Microsoft’s earnings continued growing, but the cash remaining after capital expenditure was lower than two years earlier.
The longer-term impact on profitability also matters.
Microsoft’s gross margin declined from 69.8% in fiscal 2024 to 67.9% in fiscal 2026. Higher infrastructure-related costs, including depreciation, may have contributed to this movement, although several factors influence margins.
The central question is whether these investments will generate enough additional revenue, capacity and efficiency to justify their cost.
Future demand and business performance determine the outcome, and we cannot know them in advance.
Microsoft Capital Expenditures and Free Cash Flow, 2022 to 2026
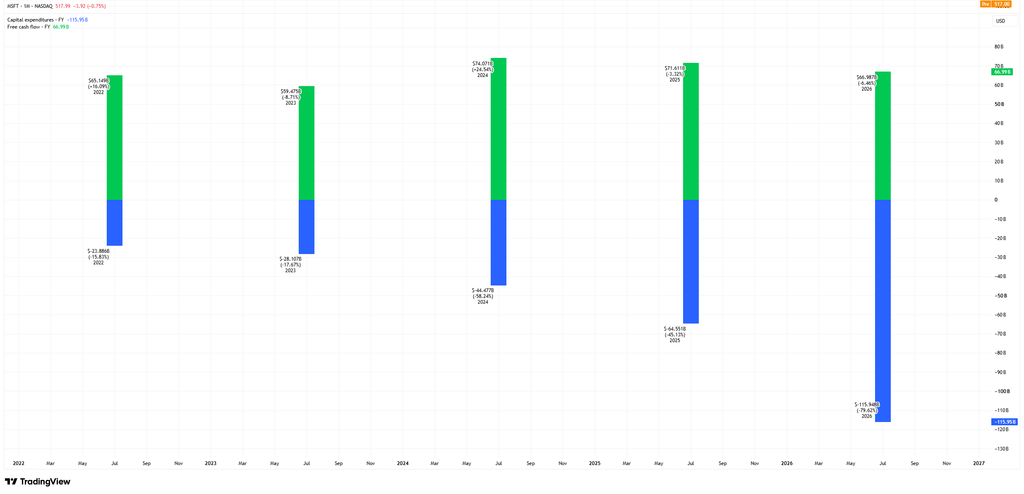
Source & Methodology: TradingView. The chart compares Microsoft’s annual capital expenditures and free cash flow for the financial years 2022 to 2026. This chart shows both measures in US dollars, in billions, as columns. Capital expenditures are shown as negative values because TradingView records them as cash outflows. Microsoft assigns the annual figures to its financial year, ending on June 30. Each observation is plotted at the end of its financial year, so its position on the calendar axis may not align exactly with the financial year label. TradingView’s standardised financial data may differ from figures reported directly in Microsoft’s filings because of provider methodology and classification. Historical figures may also be revised. Past performance is not a reliable indicator of future performance. Data as of 17 November 2026.
The chart highlights the difference between Microsoft’s growing capital expenditure and the free cash flow remaining after investment.
CapEx increased from approximately $23.9 billion in fiscal 2022 to $115.9 billion in fiscal 2026. Over the same period, free cash flow moved from approximately $65.1 billion in fiscal 2022 to $59.5 billion in fiscal 2023, before rising to $74.1 billion in fiscal 2024 and declining to $67.0 billion in fiscal 2026.
While investment spending increased substantially, free cash flow did not follow the same upward trajectory.
This does not establish whether Microsoft’s spending will ultimately deliver attractive returns. This analysis shows why capital expenditure and free cash flow should be examined together when assessing a company’s financial position and investment strategy.
The standardised figures used in the chart may differ from those reported directly in Microsoft’s financial results.
Bottom Line
Capital expenditure represents investment in assets that may support a company’s operations and future growth. Cash decreases when payments are made, while the company recognises the cost of depreciable assets over several years.
This difference helps explain why a company can report rising earnings while generating less free cash flow. Microsoft’s investment in AI and cloud infrastructure illustrates how substantial capex can coincide with strong profit growth and pressure on cash generation.
For investors, the question is not simply how much a company spends, but whether that spending is likely to generate sufficient returns over time. Investors should therefore consider capex alongside revenue growth, free cash flow, profit margins, and management’s explanation of its investment decisions.