


Silver vs Gold: What the Ratio Says About Risk Appetite
Gold and silver are often grouped together as precious metals, but they can tell very different stories about market sentiment. While gold is primarily viewed as a defensive asset and store of value, silver has a dual role. Alongside its precious-metal status, silver is heavily used in industrial applications such as electronics, solar panels and green technology.
Because of these differences, the relationship between gold and silver can provide valuable insight into investor behaviour. Traders often monitor relative performance between the two metals to assess whether markets are favouring economic growth and risk-taking or becoming more defensive.
Why Precious Metals Can Tell Different Stories
The gold-to-silver ratio is one of the most widely followed indicators within the precious metals market.
The ratio measures how many ounces of silver are required to buy one ounce of gold. When the ratio falls, silver is outperforming gold. When the ratio rises, gold is gaining relative strength.
Historically, periods of silver outperformance have often coincided with stronger economic optimism and improving industrial demand. Because silver is used extensively in manufacturing and technology, it tends to benefit when growth expectations improve.
Gold behaves differently.
As a defensive asset, gold often attracts demand during periods of economic uncertainty, geopolitical tension or concerns about inflation and monetary policy.
This means the gold-to-silver ratio can offer a useful lens through which to assess broader risk appetite across financial markets.
What Recent Price Action Is Showing
The daily chart highlights a notable divergence in performance between the two metals over recent months.
Silver remains the stronger performer over the broader lookback period, currently up approximately 11.70%, while gold has gained around 0.24% on a percentage-performance basis.
Earlier in the year, silver outperformed aggressively as optimism surrounding industrial demand and economic activity supported the metal. During that period, the performance gap between silver and gold widened significantly.
More recently, however, momentum has moderated.
As of June 2026, the gold-to-silver ratio has recovered to approximately 64.756, while the Relative Strength Index (RSI) is sitting near 37.07.
Although silver remains the stronger performer overall, these readings suggest that relative momentum has become more balanced and that gold has started to regain some relative strength.
Reading the Chart
The chart shows that both metals have generally moved in the same direction throughout much of the period, but the pace of their advances has differed.
Silver delivered stronger gains during the earlier stages of the move, while gold posted steadier and less volatile performance.
The gold-to-silver ratio reinforces this shift.
Earlier in the year, the ratio moved lower as silver outperformed, reflecting stronger confidence in economic growth and industrial activity. More recently, the recovery in the ratio suggests that gold has begun attracting relatively stronger flows.
For traders, relative performance often matters as much as absolute price direction.
Even when both metals are rising, stronger gains in silver can indicate improving confidence in economic activity and broader risk appetite. Conversely, periods of gold leadership may suggest increasing demand for defensive assets.
Silver and Gold Relative Performance with Gold-to-Silver Ratio
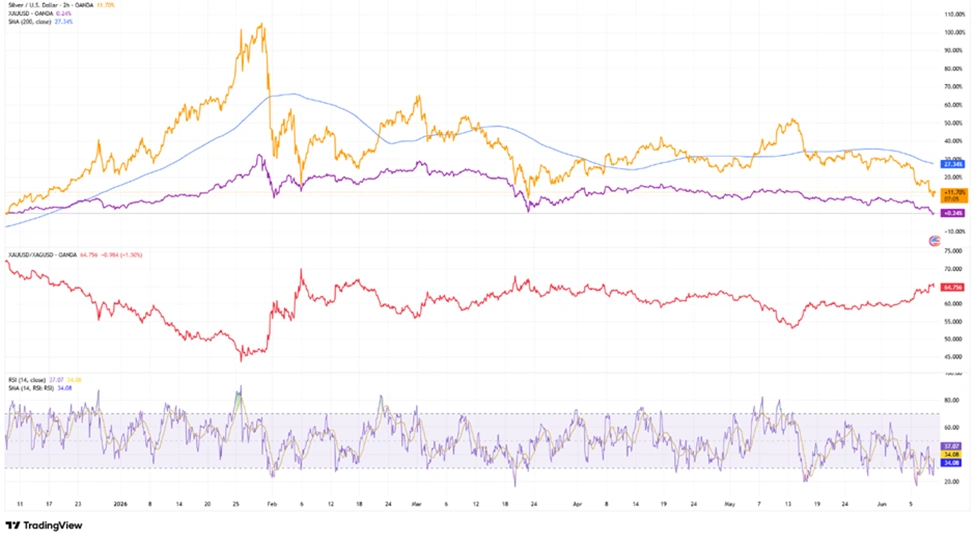
Source: TradingView. Past performance is not a reliable indicator of future performance. Data as of 10 June 2026.
Daily chart showing Silver Spot and Gold Spot on a percentage-performance basis together with the 200-period simple moving average. The middle panel displays the gold-to-silver ratio, while the lower panel shows the 14-period RSI and its moving average.
Combining Relative Performance with Technical Structure
Relative performance becomes more useful when combined with traditional technical analysis.
Traders often monitor trend direction, moving averages, support and resistance levels to determine whether a leadership shift is strengthening or fading.
As shown on the chart, momentum has moderated following the strong advances seen earlier in the year.
Silver’s 200-period simple moving average, currently tracking near +27.34% on the percentage-performance scale, highlights the strength of the broader trend even as the pace of gains has slowed.
At the same time, the narrowing performance spread between gold and silver suggests that market leadership is becoming more balanced.
This is an important development because sustained shifts in relative strength often emerge gradually rather than through sudden price moves.
Momentum and Market Psychology
Momentum indicators provide additional context.
The Relative Strength Index helps traders assess whether buying pressure is strengthening or cooling.
Recent RSI readings have eased materially from earlier highs, with the indicator currently sitting around 37.07, while its moving average is tracking near 34.08.
This suggests that momentum has moderated rather than accelerated.
Importantly, cooling momentum does not automatically signal a reversal. Instead, it often reflects a period of consolidation as markets digest earlier gains.
This moderation also aligns with what is happening in the gold-to-silver ratio.
While silver remains the stronger performer over the broader timeframe, gold has attracted relatively stronger defensive flows in recent weeks.
From a psychological perspective, silver tends to benefit when investors become more optimistic about economic growth and industrial demand. Gold, meanwhile, often attracts demand during periods of uncertainty surrounding inflation, interest rates or geopolitical developments.
Because of this, changes in leadership between the two metals can provide useful clues about broader market sentiment.
Bottom Line
The relationship between silver and gold offers traders a valuable way to assess changing risk appetite.
Although silver remains the stronger performer over the broader timeframe, the recent recovery in the gold-to-silver ratio suggests that leadership between the two metals has become more balanced, with gold gradually regaining relative strength.
As with any market relationship, neither metal should be analysed in isolation.
Relative performance, moving averages and momentum indicators work best when used together. By combining intermarket analysis with broader macroeconomic themes, traders can gain deeper insight into what may be driving sentiment beneath the surface of the market.