Relative Strength Charts: Picking Sectors Before They Rotate
Stock markets often move in waves – one sector cools as another heats up. It’s how markets rotate. Recently, the tech-heavy “Magnificent Seven” names have lost steam while cyclicals like energy and industrials have been rallying. This is why traders are eyeing relative strength charts. These charts show which sectors are outperforming and hint at who might lead next. For example, a recent analysis noted consumer discretionary and communications stocks are firmly in the “leading” quadrant on a relative rotation graph, whereas tech is rolling into “weakening” territory. Healthcare is meanwhile just beginning to climb from lagging to improving, suggesting its turn could be near.
Technical Drivers: Key Levels & Indicators
On daily charts, leading sector ETFs are forming clear patterns. For example, the Consumer Discretionary ETF (XLY) has surged roughly 40% since spring, trading near $241 with support around $230-232 and resistance just above $242. It sits above its 50-day moving average and is pressing the upper Bollinger Band (a sign of strong momentum), with RSI in the mid-60s showing robust buying pressure.
XLY Daily Chart: Consumer Discretionary Presses Resistance
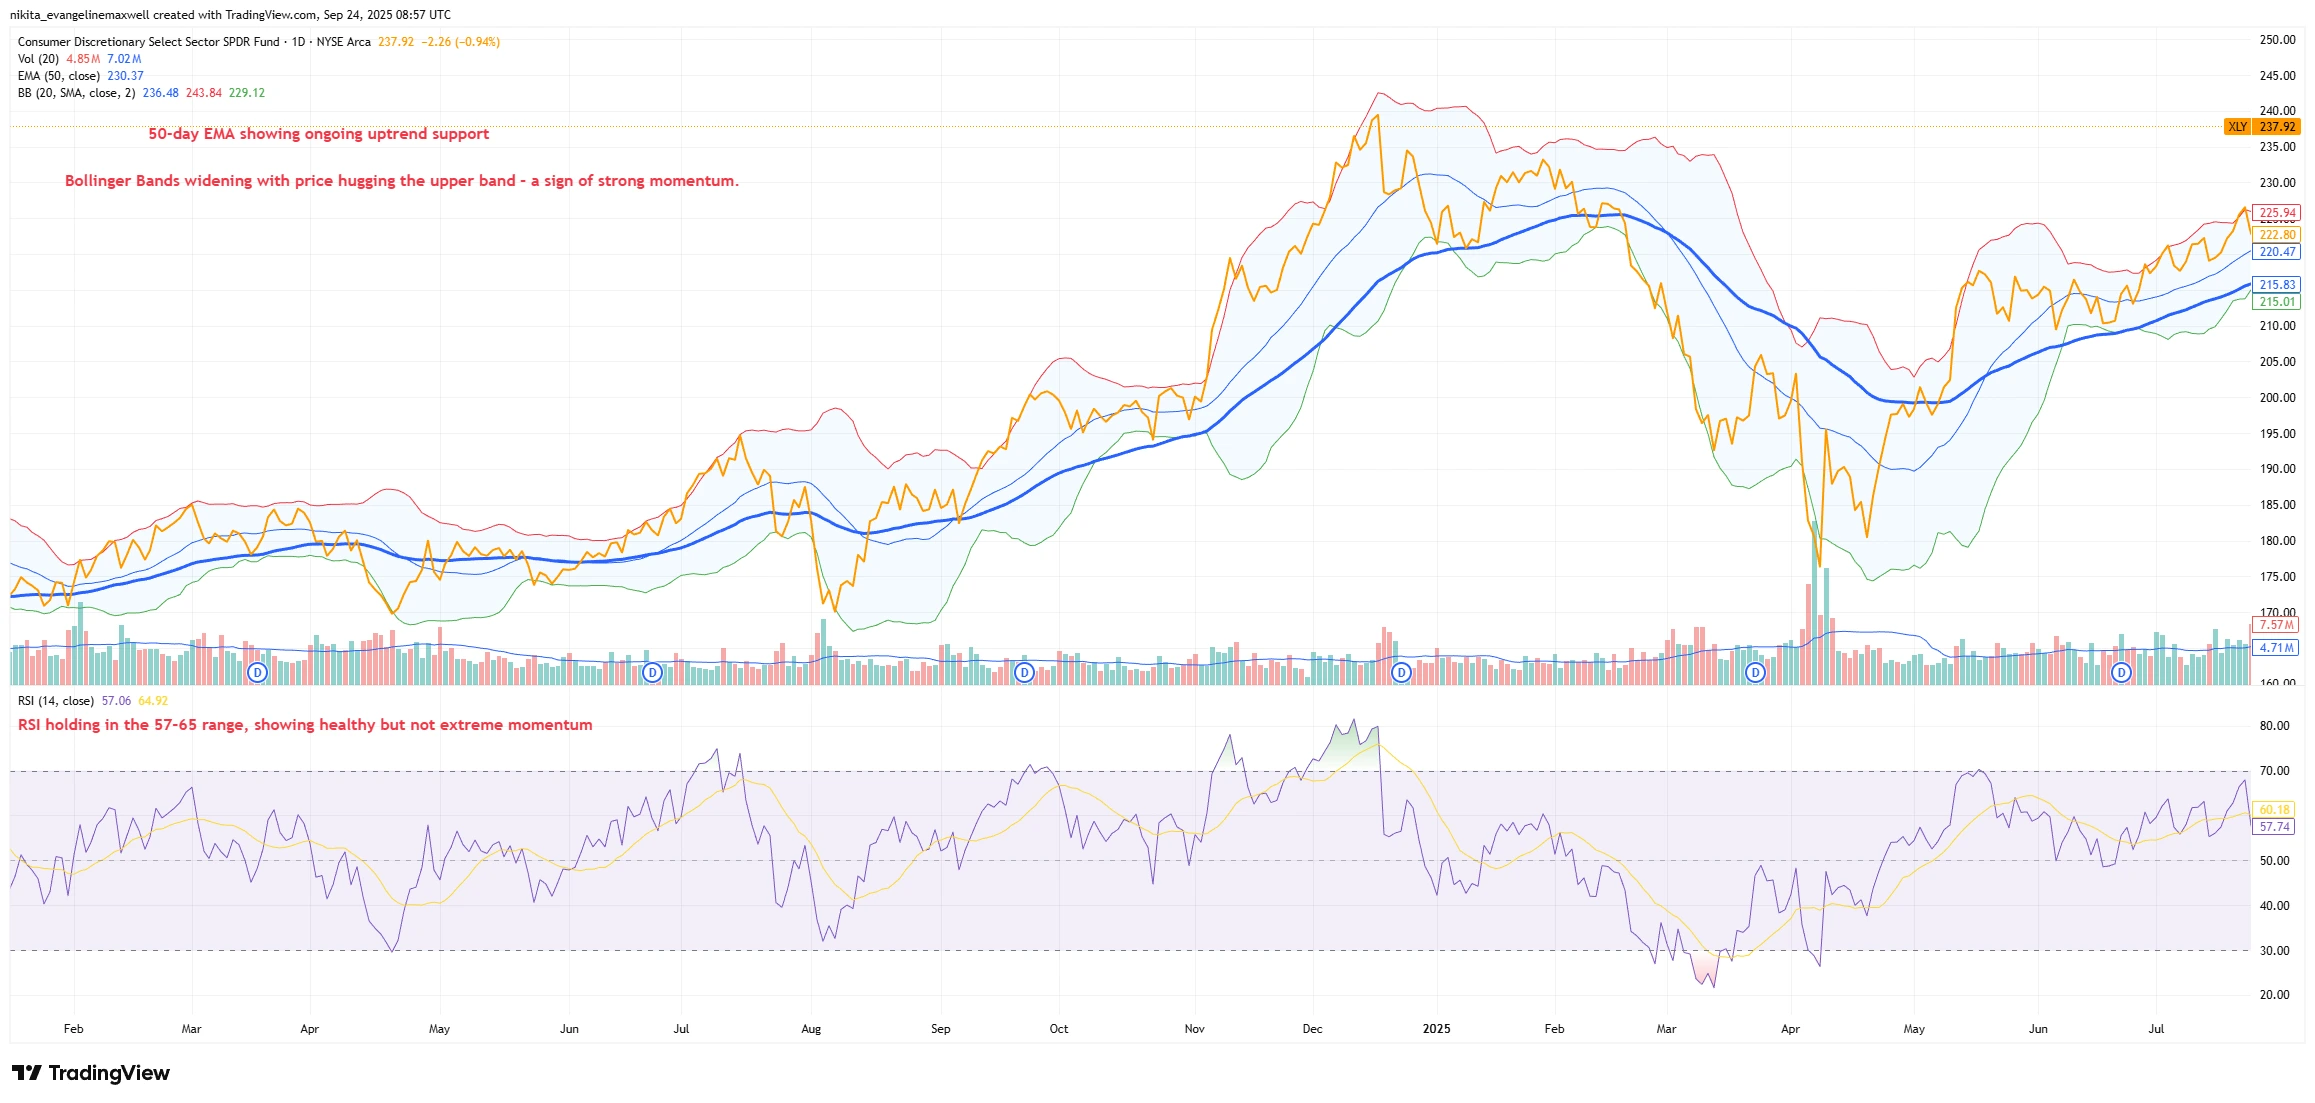
Source: TradingView. All indices are total return in US dollars. Past performance is not a reliable indicator of future performance. Data as of 24 September 2025.
Daily chart of XLY (Consumer Discretionary ETF), with 50-day EMA (blue), Bollinger Bands (green/red), and RSI (bottom panel). Price is pressing the upper Bollinger Band while staying above its EMA – a sign of strong trend momentum.
Similarly, defensive sectors are showing strength: utilities (XLU) have quietly outperformed, making higher highs and lows on their relative strength ratio versus the S&P since 2023. (In other words, the XLU/SPY line is trending up.) Volume spikes on up-days have supported these moves, confirming broad participation.
The Energy ETF (XLE) has also cleared its 200-day moving average, reinforcing that sector’s breakout. Traders will watch for breakouts above these levels on daily or weekly charts; on shorter intraday frames, a trendline or moving-average break would add conviction.
Energy Sector Strength: XLE Clears Key Levels
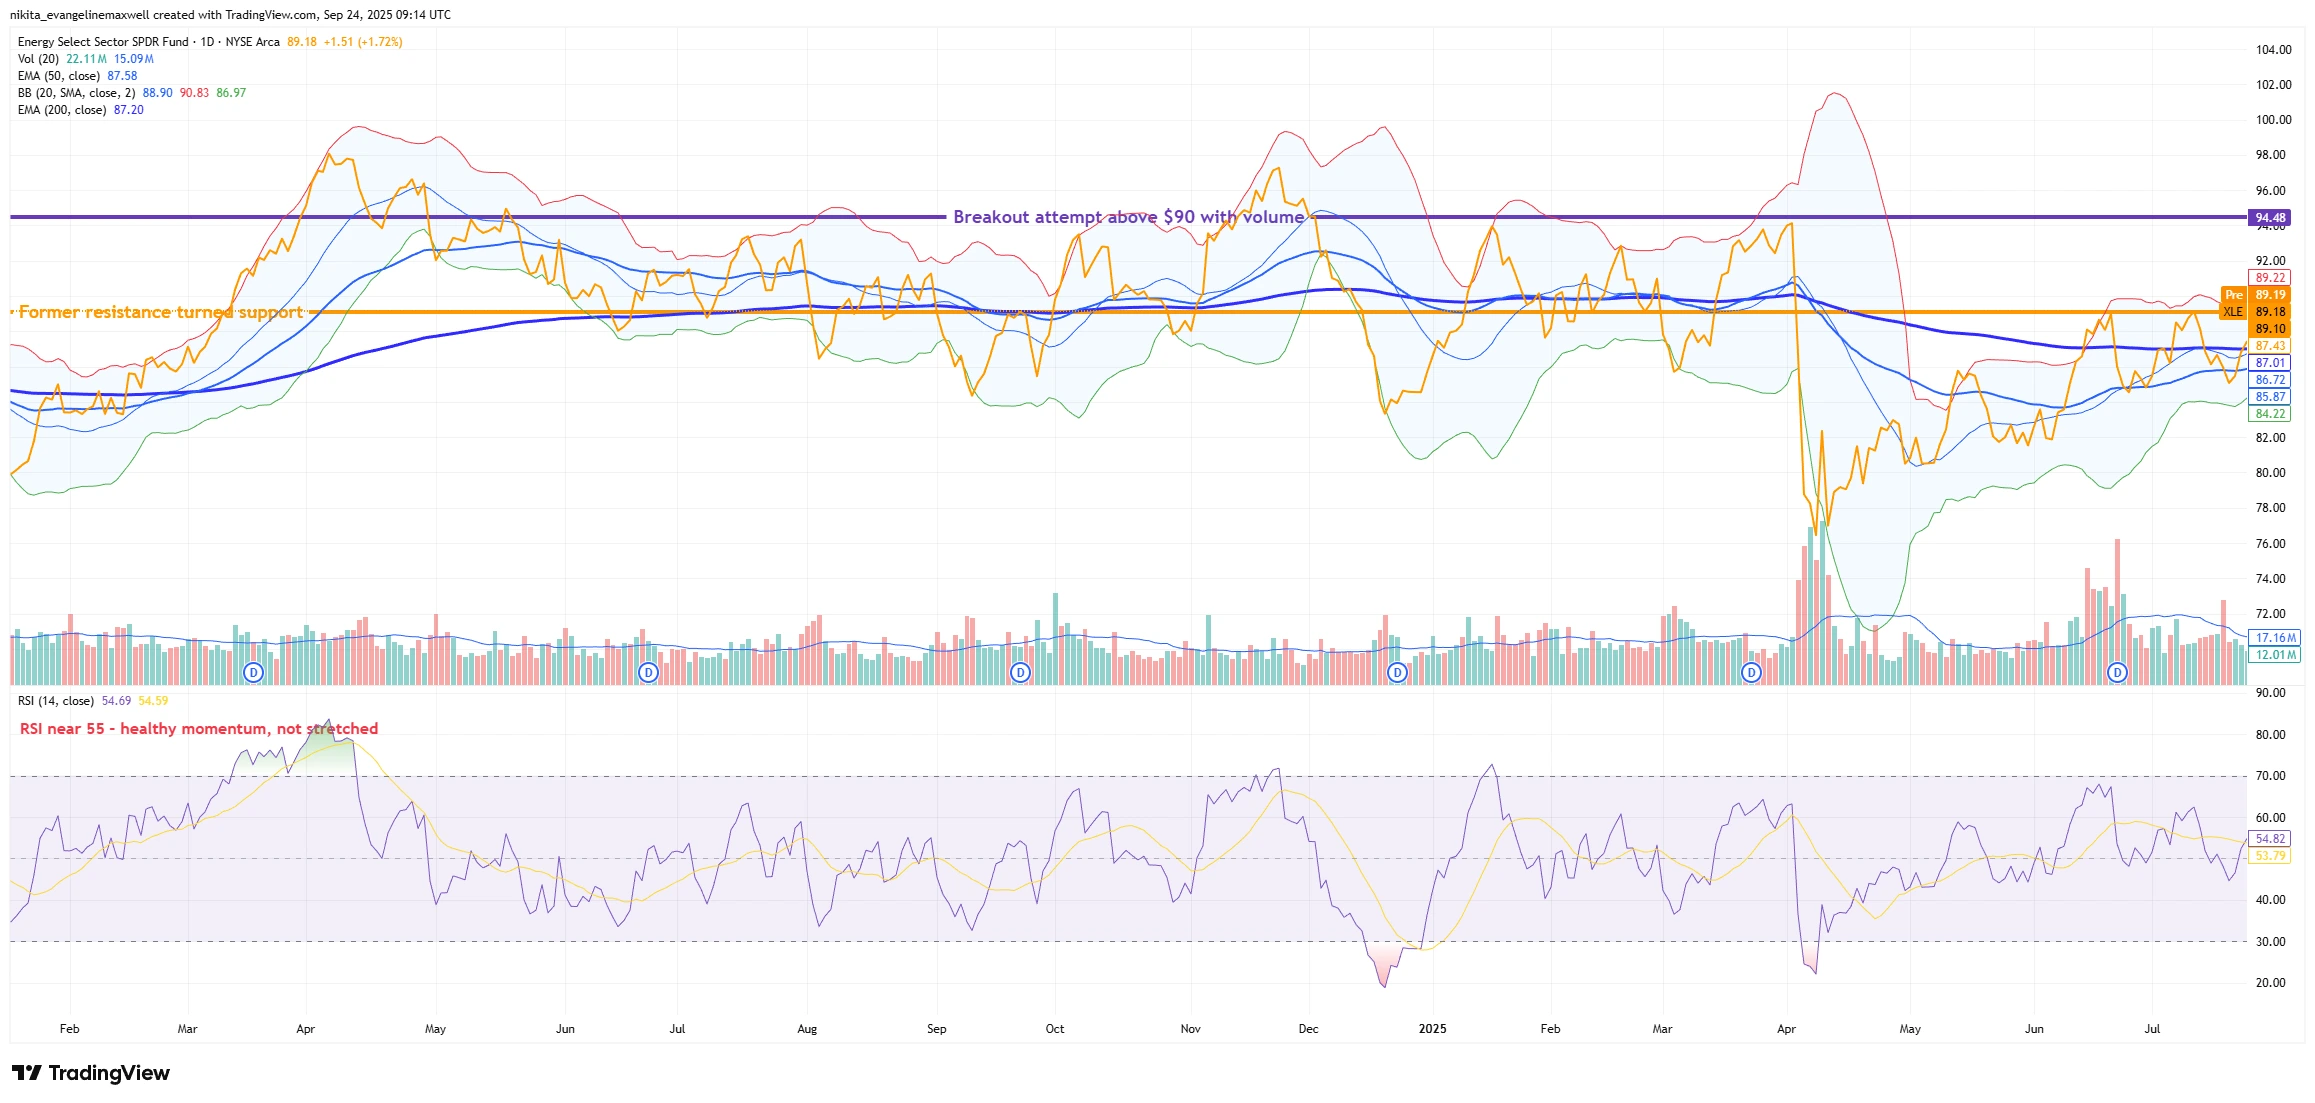
Source: TradingView. All indices are total return in US dollars. Past performance is not a reliable indicator of future performance. Data as of 24 September 2025.
Daily chart of XLE (Energy ETF), showing a breakout attempt above $90 with strong volume. Price is trading above both its 50-day and 200-day EMAs, with RSI near 55 signalling healthy momentum without being overextended.
Momentum & Pattern Watch
The annotated daily chart of the healthcare ETF (XLV) shows a classic Bollinger Band “squeeze” around ~$140 and RSI near neutral. Such a squeeze doesn’t predict direction, only that a volatile breakout or breakdown is likely. Here, traders will watch for a move above $140 on heavy volume (confirming momentum) or a drop below recent lows (a breakdown).
XLV Daily Chart: Healthcare ETF in Bollinger Band Squeeze
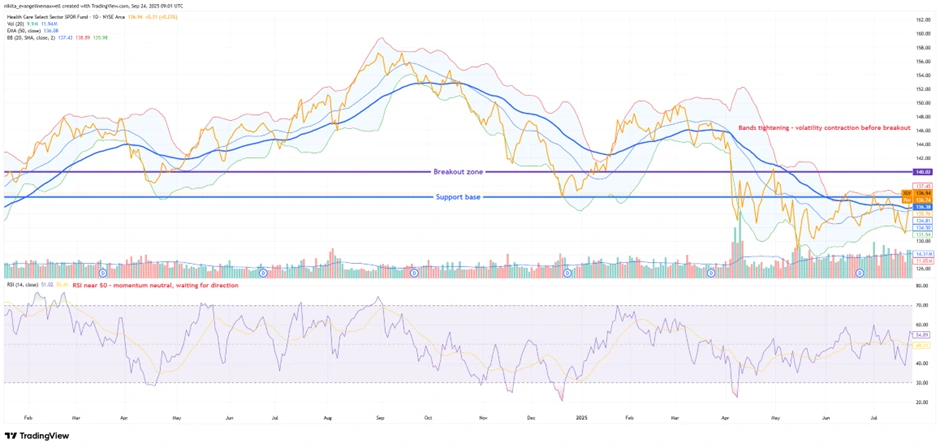
Source: TradingView. All indices are total return in US dollars. Past performance is not a reliable indicator of future performance. Data as of 24 September 2025.
Daily chart of XLV (Healthcare ETF), showing a Bollinger Band squeeze near the $140 breakout zone. RSI is neutral around 50, suggesting momentum is coiling for a potential move.
In general, look for continuation patterns like flags, pennants or triangles resolving higher, and bearish patterns (double-tops, head-and-shoulders) warning of reversals. Watch RSI or MACD for divergences – example, price makes a new high without the oscillator doing so – which often precede rotations. Likewise, a bullish MACD crossover or RSI climbing above 50 would give extra confirmation. In fact, the RRG shows healthcare shifting from “lagging” into “improving,” implying momentum is building before a likely rotation higher.
Risks & What to Watch
It’s important to mind what could derail these setups. A sharp market sell-off or risk-off swing could knock sector ETFs back to support levels. For example, if XLY can’t hold roughly $220-225, its uptrend is basically done. Traders will also monitor macro data and central bank signals. A hotter-than-expected inflation print or a hawkish Fed (or ECB) stance could stall cyclicals and send flows back into defensive sectors. Major earnings surprises in any leading group could trigger rapid rotation too. In short, if key support zones fail or economic cues turn sour, the current rotation thesis needs re-thinking.
Bottom Line
Relative strength charts help spotlight leading sectors before rotations. Key levels to watch include around $230-243 in XLY and ~$140 in XLV. A clear breakout (backed by volume/RSI) would reinforce the bullish thesis, while a failure on bad news or support breaks would invalidate it. Plan trades around these lines.