














Understanding the Copper-Gold Ratio: What Markets Are Really Pricing


The copper-gold ratio is one of the most closely watched intermarket indicators because it compares two commodities that often reflect very different views of the global economy. While copper is closely linked to industrial activity and economic growth, gold is typically associated with defensive investing and preserving wealth. Understanding how these two metals perform relative to one another can provide valuable insight into investor sentiment, changing macroeconomic conditions and broader market expectations.
Looking Beyond Two Metals
Copper and gold are among the world’s most actively traded commodities, yet they serve very different purposes within financial markets. Gold is widely regarded as a defensive monetary asset and store of value, while copper is an industrial metal whose demand depends heavily on construction, manufacturing and economic activity. Comparing the performance of these two metals can therefore offer valuable insight into what investors may be pricing into the global economic outlook.
Because of these contrasting roles, many investors and market participants monitor the copper-gold ratio as a simple way of assessing whether markets are favouring economic growth or defensive positioning. While no single indicator can predict future market movements, the ratio offers a useful perspective on changing investor sentiment.
What Is the Copper-Gold Ratio?
The copper-gold ratio is calculated by dividing the copper price by the gold price. A rising ratio means copper is outperforming gold, while a falling ratio means gold is outperforming copper. As copper is commonly quoted per pound and gold per troy ounce, the absolute figure depends on the units and price series used. Investors therefore tend to focus on its direction rather than a supposedly “correct” level.
The ratio measures relative performance rather than whether either metal is rising or falling outright. Both prices can increase at the same time, but the ratio only rises if copper appreciates by more than gold.
Why Copper Wears the Doctor’s Coat
Copper is often nicknamed “Dr Copper” because many investors believe its price reflects the health of the global economy. According to the US Geological Survey, electrical applications, including power generation, transmission, wiring and electronics, account for around three quarters of copper consumption, while construction remains its largest single end-use sector.
Why Gold Tells a Different Story
Unlike copper, gold is far less dependent on industrial production. Demand is driven primarily by investment, jewellery and central-bank purchases, while technology represents only a relatively small share of total usage. During periods of economic uncertainty or financial market volatility, investment demand for gold often strengthens as investors seek assets perceived to preserve value. Lower interest rates may also reduce the opportunity cost of holding a non-yielding asset such as gold.
Central banks continue to reinforce gold’s monetary role. World Gold Council data show that official-sector purchases exceeded 1,000 tonnes annually between 2022 and 2024. Although purchases moderated to 863 tonnes in 2025, they remained significantly above the 2010-2021 annual average of 473 tonnes.
What the Copper-Gold Ratio Can Tell Investors
When investors become more optimistic about economic growth, they may anticipate stronger demand for buildings, infrastructure, machinery and manufactured goods. Copper can then outperform gold, pushing the copper-gold ratio higher. Conversely, when recession fears, geopolitical tensions or financial uncertainty increase, investors often favour defensive assets such as gold, causing the ratio to decline.
The chart below illustrates how the relative performance of copper and gold has evolved since 2015. Although both metals have delivered positive returns over the period, leadership has shifted as markets have responded to changing economic conditions. Periods of copper outperformance have generally coincided with stronger optimism around global growth, while gold has tended to outperform during episodes of heightened uncertainty.
Copper vs Gold: Relative Price Performance (2015-Present)
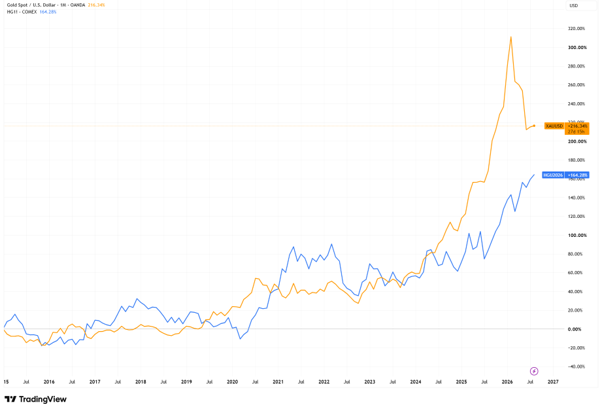
Source: TradingView. Past performance is not a reliable indicator of future performance. Data as of 4 August 2026.
Copper and gold have alternated in relative outperformance as market expectations have shifted between economic growth and defensive positioning. The chart illustrates how these changing macroeconomic environments have influenced the performance of both metals since 2015.
How Traders Use the Copper-Gold Ratio
Many traders monitor the copper-gold ratio alongside PMIs, inflation, employment, bond yields and equity markets to assess whether markets are favouring economic growth or defensive positioning.
Why the Signal Can Mislead
Although the copper-gold ratio can provide valuable insight, neither metal responds solely to changes in economic growth.
Copper prices may be influenced by mine disruptions, labour disputes, weather events, declining inventories or changes in concentrate availability, even when economic activity is weakening. Gold, meanwhile, is often driven by central-bank purchases, changes in real interest rates, inflation expectations, currency movements and geopolitical developments, regardless of the broader economic cycle.
Recent International Copper Study Group forecasts have highlighted how changes in mine supply and concentrate availability can materially alter copper market balances, demonstrating that supply-side factors can complicate the macroeconomic message.
Bottom Line
Copper and gold sit at opposite ends of the economic spectrum. Copper is closely tied to industrial activity, infrastructure investment and growth expectations, while gold is more sensitive to monetary conditions, reserve demand and investors’ search for financial protection.
The copper-gold ratio offers a useful way of understanding which of these narratives markets are currently favouring. While it cannot predict turning points with certainty, it provides valuable context when interpreted alongside broader macroeconomic and financial market indicators, making it one useful piece of a wider fundamental analysis framework rather than a standalone forecasting tool.