














Why Bank Stocks Matter for the US 500 Index


The financial sector plays an important role in the US economy, making bank stocks a key area of focus for many traders and investors. Because major banks are closely linked to lending activity, corporate investment and consumer spending, their share prices can often reflect changing expectations about economic growth. By comparing the performance of leading US banks with the US 500, traders can gain additional insight into sector leadership, market sentiment and the strength of the broader equity market.
Why Bank Stocks Matter
Banks play a central role in the US economy and represent a significant weighting within the US 500, one of the world’s most widely followed stock market indices. Large financial institutions such as JPMorgan Chase, Goldman Sachs and Bank of America sit at the heart of lending, investment banking, capital markets and consumer finance. Because of this, their share prices often provide an early indication of how investors feel about economic growth and business conditions.
Traders regularly monitor the performance of these major banks alongside the US 500 to see whether the financial sector is supporting or lagging the wider market. Many also follow the Financial Select Sector SPDR Fund (XLF), an exchange traded fund (ETF) that invests in many of the largest US financial companies. Because it tracks the financial sector as a whole rather than a single bank, it provides a useful snapshot of how the sector is performing overall. While bank stocks should never be viewed as a standalone predictor of future market direction, they can offer useful insight into changing investor sentiment.
Understanding Market Leadership
Different sectors tend to lead the market at different stages of the economic cycle, a process commonly known as sector rotation.
When financial stocks outperform the broader market, it can suggest that investors are becoming more confident about economic activity, lending conditions, and corporate earnings. On the other hand, if banks begin to underperform while the wider market continues to rise, traders may see it as a sign that market leadership is becoming narrower and that fewer sectors are driving the advance.
Sector leadership changes over time, which is why traders combine it with other technical and fundamental factors rather than relying on it alone.
Reading the Technical Chart
The chart provides a useful comparison of how major US bank stocks have performed relative to the broader market over the same period.
The upper panel compares the percentage performance of the US 500 with JPMorgan Chase, Goldman Sachs, Bank of America, and the Financial Select Sector SPDR Fund (XLF), which represents the performance of the broader US financial sector. Although all five broadly followed the same trend, Goldman Sachs delivered the strongest performance over the period, followed by Bank of America and JPMorgan, while XLF also moved higher but lagged the strongest individual bank shares. This demonstrates that although the financial sector remained broadly strong over the period, individual banks did not all contribute equally, with some significantly outperforming the broader sector.
The middle panel compares the average percentage performance of JPMorgan Chase, Goldman Sachs, and Bank of America against the US 500. The basket of bank stocks outperformed the broader index over the period, highlighting how strength within the financial sector often coincided with strength across the wider equity market. Comparing sector performance with the benchmark index helps traders identify where capital is flowing and which parts of the market are leading overall performance.
Relative Performance of Major US Bank Stocks, the US 500, and the Financial Sector (XLF)
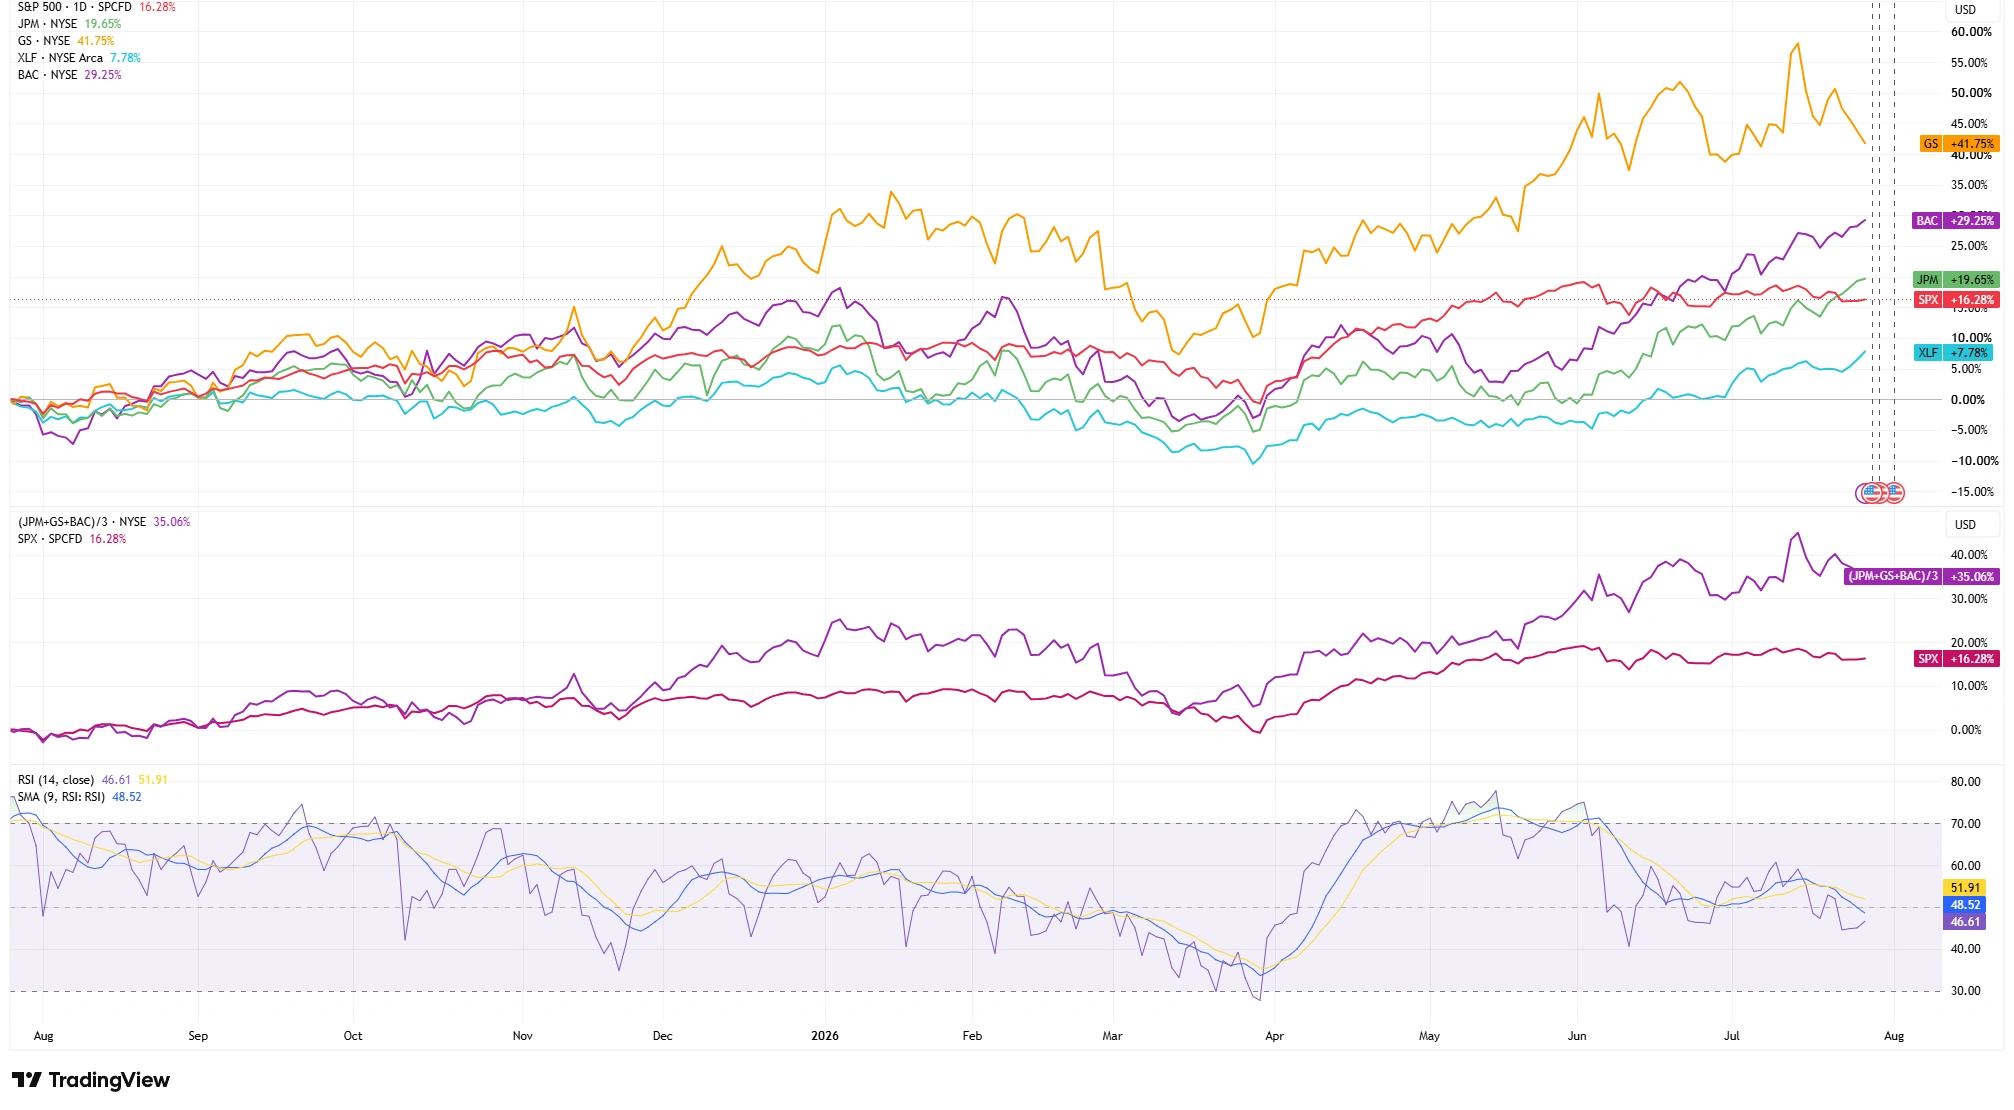
Source: TradingView. Upper panel compares the percentage performance of the US 500, JPMorgan Chase, Goldman Sachs, Bank of America, and XLF. The middle panel compares the average performance of JPMorgan Chase, Goldman Sachs, and Bank of America against the US 500. The lower panel displays the 14-period Relative Strength Index (RSI) together with its moving average. Past performance is not a reliable indicator of future performance. Data as of 29 July 2026.
Why Earnings Season Matters
Bank earnings are among the first major corporate results released each earnings season, making them an important early indicator of corporate health and economic conditions. Their results often help shape expectations for the rest of the earnings season. Because banks report before many other large companies, traders often view their results as an early indication of broader corporate health.
Strong earnings, healthy loan growth, improving trading revenues, or positive guidance can boost confidence across financial markets. On the other hand, weaker than expected results may raise concerns about the economy or future corporate performance. Rather than reacting to the headlines alone, traders usually compare the results with market expectations and watch how prices respond afterwards.
Momentum and Relative Strength
The lower panel shows the 14-period Relative Strength Index (RSI) alongside its moving average. At the time of analysis, the RSI is around 46.6 while its moving average sits close to 48.5.
This suggests bullish momentum has moderated from earlier highs and is currently relatively balanced rather than strongly bullish or bearish. Most traders use RSI to confirm what price is already showing rather than relying on it as a trading signal by itself. When momentum supports the broader trend and relative performance remains strong, it can provide additional confidence that the prevailing market direction remains intact.
The Psychology Behind Sector Leadership
Investors regularly rotate capital between different sectors as expectations for economic growth, interest rates, inflation, and corporate profitability change.
When confidence in the economy improves, financial stocks often attract greater interest because stronger economic conditions can support lending activity, investment banking, and trading revenues. During more uncertain periods, investors may shift towards more defensive sectors instead. Watching how bank stocks perform relative to the broader market can therefore provide valuable insight into changing investor sentiment, even though it should always be considered alongside other technical and fundamental factors.
The Bottom Line
Bank stocks are closely watched because they often reflect changing expectations about economic growth and investor confidence. However, they represent only one part of the broader market picture.
No single indicator tells the whole story. Looking at sector performance alongside price action, momentum, earnings results, and overall market conditions gives traders a more balanced view of what is happening beneath the surface. Technical analysis is generally more reliable when multiple forms of confirmation align, rather than relying on any single indicator in isolation.