Common Indicators: RSI, MACD, Moving Averages
Do you ever feel like you're trading blind? Entering a position and just kind of hoping for the best? Well, believe it or not, many traders feel this way! This is where trading indicators come in. But how do they work exactly? Which are the best indicators for day trading? And how do trading tools like RSI, MACD indicator or a moving average work in your favour? Well, in this article we are going to break down the best indicators for day trading. We will answer common questions: 'What is RSI?', 'What is MACD?' and 'What is Moving Average?'. By the end of this course, you’ll know exactly how to use the best indicators and when to use which tool!
So let’s get straight into it!
Best Indicators for Day Trading: What are Trading Indicators and Why are they so important?
Before we jump into the details, let’s start from the very top and first answer the big question: What are trading indicators?
In the simplest terms, trading indicators are tools built into your charting platform (like TradingView or MetaTrader). These indicators can help you:
- Identify entry and exit points.
- Confirm trends.
- Spot potential reversals.
- Gauge momentum or market strength.
With day trading, timing is absolutely everything, and understanding the best indicators to use for day trading can make the difference between a win and an endless guess. So let’s break them all down together, starting with RSI.
What is RSI?
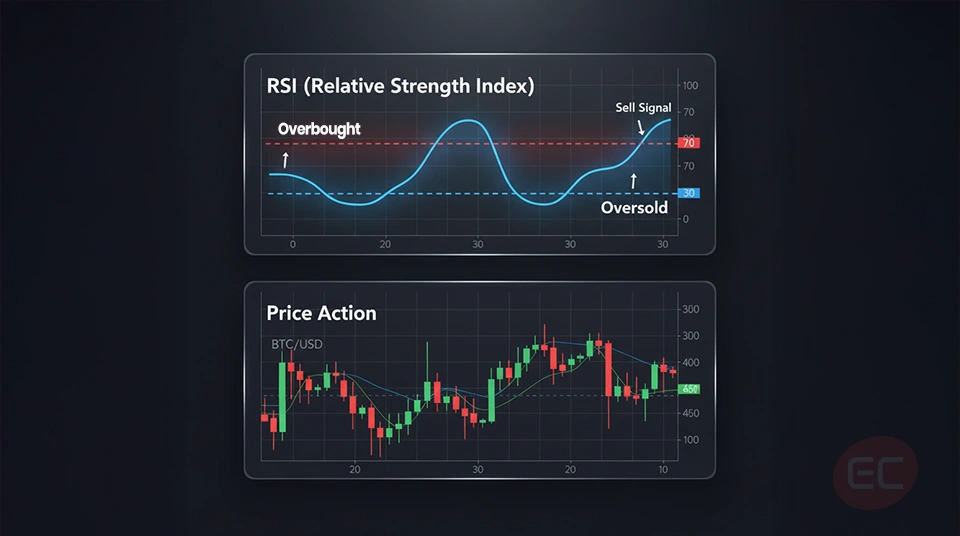
RSI, what does it stand for? RSI stands for Relative Strength Index. But what is it exactly?
The RSI indicator essentially measures the speed and change of recent price movements. It ranges from 0 to 100 and it can help you spot when an asset is overbought (in other words: too expensive) or oversold (in other words: too cheap).
- Above 70 = Overbought (possible reversal down).
- Below 30 = Oversold (possible reversal up).
Does it make sense? Let’s look at a real life example:
Let’s assume Bitcoin’s RSI is at 80, that’s a clear sign that the rally might be overheating. In this case, smart traders using trading indicators like the RSI would want to wait for a pullback before they buy in. During day trading, this is how the best indicators can help you avoid chasing highs or buying into dips too early, and they can make a huge difference in your trading experience, so understanding how it works is crucial.
Let’s look at the next indicator, another very common one: MACD
What is MACD?
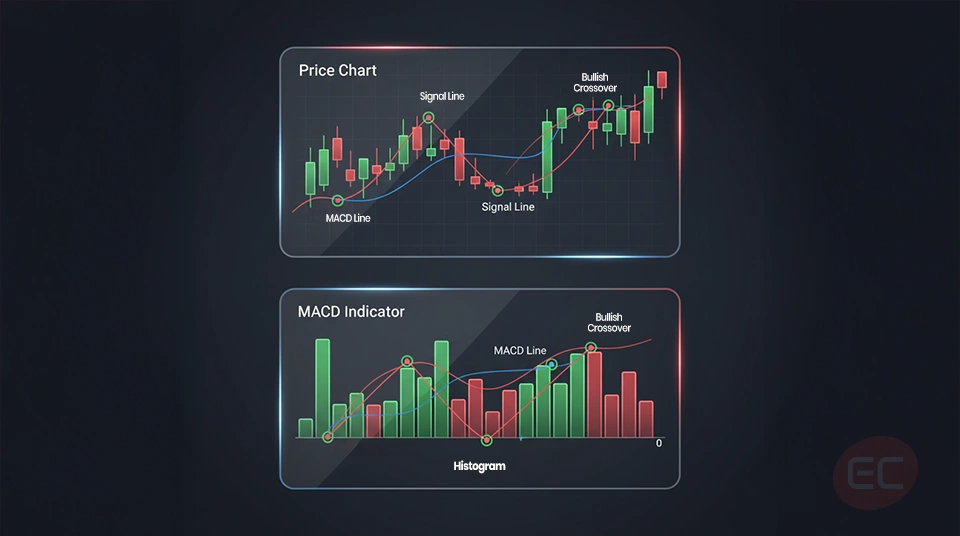
The MACD indicator, a favourite among traders! But what is MACD and what does it do?
The MACD (Moving Average Convergence Divergence) is a momentum indicator, it shows the relationship between two moving averages of a price.
The MACD Indicator is made up of:
- The MACD line (the difference between 12 and 26 EMA).
- The signal line (9-day EMA of the MACD line).
- A histogram that shows the gap between the two lines.
What does it mean when the MACD line crosses above the signal line? It’s a buy signal. And when it crosses below? It’s a sell signal. Sounds simple enough? But what is the MACD indicator one of the best and most popular indicators for day trading? Well, because it combines trend, momentum, and potential reversal into one simple and clear visual. So if you’re asking what is MACD, just remember this: it tells you when the momentum is shifting, a piece of information that is absolutely necessary for every trader.
Now that we’ve explored RSI and MACD indicator, let’s go onto the next: moving averages.
What is Moving Average and How does it work?
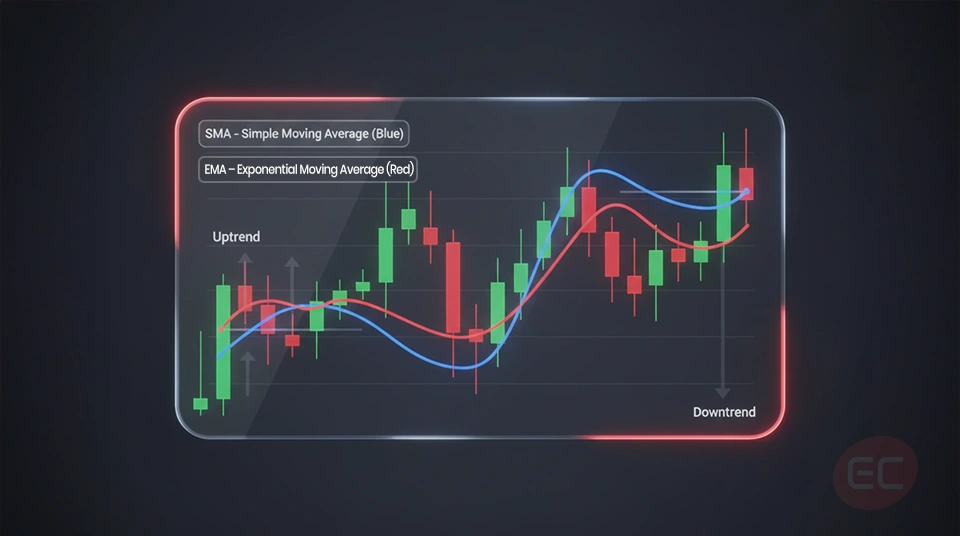
Let’s now take a look into the absolute classic: the Moving Average. What is moving average in trading? A moving average smooths out price data over a certain period of time. In other words, it can help you identify the direction of a trend without actually being distracted by the short term noise.
There are two main types of moving averages:
- You have the Simple Moving Average (SMA): it averages the price over a set number of periods.
- And you have the Exponential Moving Average (EMA): it gives more weight to recent prices.
The moving average is especially like the backbone of many trading indicators, when the price stays above the moving average, it’s an uptrend, and when it's below it? It’s a downtrend.
Now that we've answered 'What is Moving Average?', you might be wondering why these are the best indicators for day trading? Let's find out!
Why are these the best Indicators for Day Trading and How do you use them?
You might be wondering why these specific tools, including the RSI, MACD indicator and moving averages are so often called the best indicators for day trading?
Simple really, it’s because they do three crucial things:
- They spot trends with the moving average.
- They confirm momentum shifts using the MACD indicator.
- And they identify overbought/oversold zones using RSI.
Here’s an example of how to combine them:
- When price is above the 50 EMA (trend is up).
- MACD just crossed above its signal line (momentum rising).
- RSI is around 50 (no overbought risk yet).
Let’s see if you really understand the differences between these indicators. Challenge time!
On your computer, tablet or phone, open up a chart on your favourite trading platform, and ask yourself:
- What is RSI showing right now? Is it above 70 or below 30?
- Is the MACD indicator showing a bullish or bearish crossover?
- Where is the current price in relation to the 50 or 200 moving average?
By understanding and using these trading indicators together, you’re not guessing anymore, instead, you’re actually reacting based on reliable data. The result? Informed, well thought out decisions that will improve your trading success!
Just like anything, mistakes happen! So understanding the most common mistakes can help you avoid them. Let’s narrow down some of the most common mistakes that many traders make:
Common Mistakes even when using the best Indicators for Day Trading
Even the best indicators for day trading won’t work if they’re used in the wrong way. So here are some common errors beginners make. If you learn them, you can avoid them!
- Don’t use too many indicators that give conflicting signals
- Do not ignore the overall trend.
- Do not misunderstand what the indicator actually measures.
That’s why learning what is RSI, what is MACD, and what is moving average is more important than simply understanding the theory. It’s about practice, patience and trial & error. Remember, always start on a demo account when practicing a new trading skill.
What is RSI vs. MACD
Are you still a bit confused about the difference between what is RSI and what is MACD? Not to worry! We’ll break it down in a simple comparison table.
| Feature | RSI | MACD |
| Measures | Overbought/Oversold levels | Momentum & trend changes |
| Good For | Reversal spotting | Trend confirmation |
| Common Signal | Above 70 = sell, below 30 = buy | Crossovers = momentum shift |
They’re both extremely powerful tools, and when they’re used together, they can become even stronger trading indicators, so putting them into practice is crucial!
How to customise Indicators for the best Trading Strategy
Just because these are the best indicators for day trading doesn’t mean you can’t adjust them to fit your trading style.
Here’s an example of how you might be able to adjust them:
- The RSI from 14 to 7 for faster signals.
- The MACD indicator settings to better suit crypto or forex.
- Your moving average period from 50 to 20 if you're scalping.
The key point to remember is this: know why you’re making changes, and what your end goal is, because a small tweak can either enhance your trading strategy or break it all together.
So if you're asking what is RSI, what is MACD, or what is moving average, understand also how they behave in different markets and timeframes.
Conclusion: The Best Indicators for Day Trading
If you’ve made it this far into the course you should have a good understanding on what indicators are, but let’s wrap it all up.
- Knowing what is RSI, what is MACD, and what is moving average is crucial for every serious trader.
- These aren’t just lines on a chart, they’re tested tools used by pro traders to time trades with more accuracy and more information.
- The best indicators for day trading aren’t overly complicated, but actually, they’re consistent, reliable, and help filter out the noise so you can make better, more informed trading decisions.
Mastering these trading indicators won’t make you a professional trader overnight, but they will make you more prepared.
We hope you enjoyed this course and had your questions about common indicators answered: What is Moving Average, RSI and MACD. Keep on reading the EC Markets Academy as we unlock more crucial trading knowledge that will get you from a novice trader to a knowledgeable trader.