


Why the Opening Price Matters: Where Did the Session Begin?


Table of Contents
- What Is the Opening Price?
- How to Identify the Opening Price on a Candlestick
- Opening Price Example: Reading a Candlestick
- Opening Price vs Previous Closing Price: What’s the Difference?
- What Can Price Relative to the Open Tell Us?
- The Opening Price in Practice: XAU/USD Daily Chart
- Limitations of Opening Price Analysis
- Bottom Line
Every candlestick has a starting point. The opening price tells us where a trading period began, providing a reference for understanding how prices moved before the period ended.
But the price when markets open is not necessarily the lowest price of a rising candle or the highest price of a falling one. Nor is it always the same as the previous session’s closing price.
Understanding these distinctions helps traders read candlestick charts more accurately and interpret price movements within a selected timeframe.
What Is the Opening Price?
The opening price is the first price recorded for a chart period, subject to the instrument’s trading arrangements and the data provider’s methodology.
Every candlestick has its own price when markets open. A daily candle represents one daily trading period, while an hourly candle represents one hour. An hourly candle’s open is therefore not necessarily the daily session’s opening price.
Once a standard candle begins, its recorded price normally remains fixed. Its high, low and latest price can continue changing until the period ends.
A chart candle’s open should also be distinguished from an exchange’s official opening price. Some exchanges, including the New York Stock Exchange (NYSE), use opening auctions to bring orders together under venue rules and establish an opening price.
For instruments such as spot gold (XAU/USD), daily candle boundaries depend on the selected data provider’s session definition. OANDA’s documentation, for example, describes how daily candles are aligned using a specified hour and timezone. Gold does not have one universal worldwide opening price or opening time.
How to Identify the Opening Price on a Candlestick
A standard candlestick displays four prices: open, high, low and close, commonly referred to as OHLC.
The candle’s body connects the opening and closing prices, while its wicks extend towards the highest and lowest prices recorded during the period.
On a rising candle, the opening price appears at the bottom of the body and the closing price at the top. On a falling candle, these positions are reversed.
Green and red are commonly used to distinguish rising and falling candles, although chart colours can be customised. TradingView also offers a setting that colours candles according to the previous close. The chart used in this article colours each candle according to its own opening and closing prices.
Importantly, the lower wick of a rising candle does not necessarily represent its opening price. It identifies the lowest price reached during that period.
For a broader introduction to how candlesticks represent price movements, explore our guide to candlestick patterns.
Opening Price Example: Reading a Candlestick
Consider a hypothetical trading period with the following prices:
| Price | Value |
| Open | $100 |
| High | $105 |
| Low | $98 |
| Close | $103 |
The market opened at $100 and closed at $103, meaning the price finished $3 above its starting point.
This produces a rising candle, with the opening price at the bottom of its body and the closing price at the top.
However, the market also traded as low as $98 and as high as $105 during the period. The wicks therefore extend beyond the body, showing that the opening and closing prices were not the session’s extremes.
The completed candle describes the relationship between these four prices. It does not reveal whether the high or low occurred first or predict what will happen during the next period.
Opening Price vs Previous Closing Price: What’s the Difference?
The opening price of the current period and the closing price of the previous period are two separate observations.
They may be identical, but they can also differ, particularly between trading sessions following overnight developments or a weekend.
This distinction matters because a candle’s colour reflects the relationship between its own opening and closing prices, not necessarily whether the market has gained or lost value compared with the previous period.
For example:
Suppose the previous day’s closing price was $100.
The next trading period opens at $95 and closes at $98.
Although the price rose by $3 from its opening level, it still finished $2 below the previous day’s close.
The candle would therefore be green when coloured according to its own open and close, despite the market finishing below the previous session’s closing price.
The reverse can also occur. A red candle may finish above the previous close if it opened sufficiently higher.
Understanding this difference helps distinguish movement within a trading period from the change between two consecutive closing prices.
However, the chart alone does not establish why the price when markets open differs from the previous close.
What Can Price Relative to the Open Tell Us?
The price at market open provides a fixed reference point for assessing how price changes during a selected period.
When price trades above the open, it is higher than the period’s starting level. When it trades below the open, it is lower than that starting level.
On an unfinished candlestick, this relationship can change as new prices are recorded. A candle that initially appears to be rising may eventually close below its opening price, or vice versa.
Once the period is complete:
- A close above the open describes a net price increase during that period.
- A close below the open describes a net price decrease during that period.
- A close equal to the open indicates that the period finished at its starting price, even if prices moved considerably in between.
These comparisons describe the outcome of the period rather than the sequence of movements within it.
The price alone does not reveal trading volume, institutional activity or the cause of a price movement. It should not be treated as guaranteed support, resistance or fair value.
The Opening Price in Practice: XAU/USD Daily Chart
Gold’s daily candlestick chart provides a practical example of how the price relates to the closing price and the extremes reached during a trading period.
The annotated candle from 4 November 2026 highlights the opening and closing prices of a completed rising candle.
XAU/USD Daily Candlestick Chart
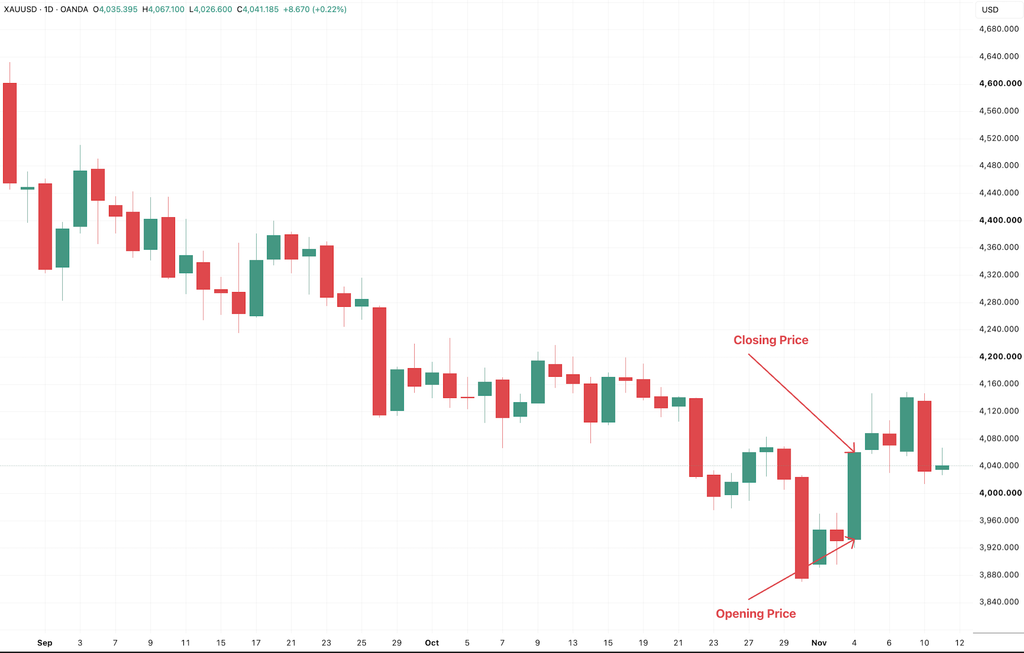
The opening price appears at the bottom of the green candle’s body, while the closing price appears at the top.
Because the candle finished above its opening price, it represents a net increase during that daily period. The distance between the two body edges illustrates the difference between the starting and finishing prices.
The upper and lower wicks extend beyond the body, showing that gold traded at prices above and below those two reference points during the session.
However, the candle does not establish the exact sequence of movements between its opening, high, low and closing prices.
The chart uses standard daily candlesticks on a linear price scale without additional indicators. Daily boundaries follow the data provider’s session definition, and the latest candle was unfinished when the chart was captured on 11 November 2026. Annotations are provided for educational purposes.
Limitations of Opening Price Analysis
The opening price is one reference point within a broader record of price movements. Its interpretation depends on the timeframe, data feed and session definition.
A completed candle closing above its open does not guarantee further gains, just as a close below the open does not guarantee continued declines.
The open also cannot explain the reasons behind a movement or establish whether a particular price level will act as support or resistance.
For a more complete interpretation, traders can consider the opening price alongside surrounding candles, support and resistance levels and the wider price structure.
Bottom Line
The opening price shows where a trading period began, providing a reference for understanding how prices changed before the period ended.
Comparing the open with the close helps identify whether a candle recorded a net rise or decline, while the high and low reveal the extremes reached along the way.
Crucially, the current opening price and the previous closing price are different reference points. Understanding that distinction helps traders interpret candlestick movements more accurately without treating historical price behaviour as a prediction of future direction.