














Why Revenue Growth Does Not Always Lead to Higher Profits


A company reports higher revenue, suggesting that demand for its products or services is growing. Yet its profit remains unchanged or declines. Although this may appear contradictory, greater sales do not automatically make a business more profitable.
Revenue measures the income generated before most business expenses are deducted. Profitability depends on how much it costs to generate those sales, the type of revenue being earned and how efficiently the company operates.
Revenue and Profit Measure Different Things
Revenue is the income a company generates from selling goods or services before expenses are deducted.
Gross profit is revenue minus the direct cost of producing those goods or services. Operating profit deducts additional expenses such as wages, marketing, technology and administration. Net income also accounts for interest, taxes and certain non-operating items.
Earnings per share divides the profit attributable to shareholders by the weighted average number of shares. Free cash flow measures the cash generated from operations after capital expenditure.
These measures can move in different directions. A company may generate more revenue but retain less profit when its costs increase faster than its sales. These differences are why revenue growth alone does not provide a complete picture of a company’s financial performance.
Rising Costs Can Absorb Revenue Growth
Consider a simplified hypothetical company whose revenue rises from £100 million to £110 million, representing growth of 10%.
During the same period, its operating costs increase from £80 million to £95 million. Operating profit therefore falls from £20 million to £15 million despite the higher revenue.
The business has generated additional sales, but those sales have been more expensive to produce. Higher wages, raw-material prices, transportation costs, marketing expenses or technology investment can all absorb revenue growth.
Why Profit Margins Matter
A profit margin shows how much profit a company retains from each unit of revenue.
In the hypothetical example, the operating margin falls from 20% to approximately 13.6%. The lower margin reveals that the additional revenue has not translated into stronger profitability.
Declining margins may reflect rising input costs, customer discounts, weaker pricing power, an unfavourable product mix or operating inefficiencies.
However, temporary margin pressure is not always evidence of a deteriorating business. A company may accept lower current profits while investing in products, infrastructure or geographical expansion. The important question is whether the spending is likely to support sustainable future returns.
Revenue Quality and Business Mix
Not every source of revenue carries the same margin.
A company may generate strong growth from lower-margin products while sales from more profitable products weaken. Total revenue can consequently rise while the overall operating margin falls.
Revenue growth may also come from acquisitions rather than expansion within the existing business. An acquisition can increase reported sales immediately, but integration costs, interest expenses and restructuring charges may prevent profits from rising at the same pace.
Currency movements can also affect reported revenue without representing an equivalent change in underlying demand.
Operating Leverage and Cash Flow
Operating leverage describes how fixed costs affect profit when revenue changes.
Businesses with substantial fixed costs may experience rapidly rising profits once sales exceed the level needed to cover those expenses. The same structure can work in reverse when demand weakens because costs such as rent, technology infrastructure and permanent staffing do not decline immediately.
Accounting profit and cash flow may also differ. A company can record revenue before receiving payment, while additional inventory, equipment or facilities may consume cash.
Revenue growth may therefore be assessed alongside operating profit and free cash flow rather than treated as a complete measure of performance on its own.
Amazon: Higher Sales but Lower Operating Profit
Amazon provided a clear example in 2022. Full-year net sales increased by 9%, from $469.8 billion to $514.0 billion. Excluding the unfavourable effect of currency movements, sales increased by 13%.
Despite this growth, operating income fell from $24.9 billion to $12.2 billion. Based on Amazon’s reported figures, this reduced its operating margin from approximately 5.3% to 2.4%.
Amazon’s North America segment moved from operating income of $7.3 billion to an operating loss of $2.8 billion. The International segment’s operating loss widened from $0.9 billion to $7.7 billion, while Amazon Web Services remained profitable and increased its operating income.
Amazon’s results identified factors including inflation, fulfilment-network productivity and investment in capacity as influences on operating performance. Its fourth quarter also included approximately $2.7 billion of charges related to changes in self-insurance estimates, impairments of property and equipment, operating leases and severance costs.
Free cash flow recorded an outflow of $11.6 billion in 2022, compared with an outflow of $9.1 billion in 2021. The figures demonstrate that stronger sales did not automatically produce higher operating profit or improved cash generation.
Amazon’s 2022 fourth-quarter and full-year results
Amazon Revenue and Operating Margin, 2020-2024
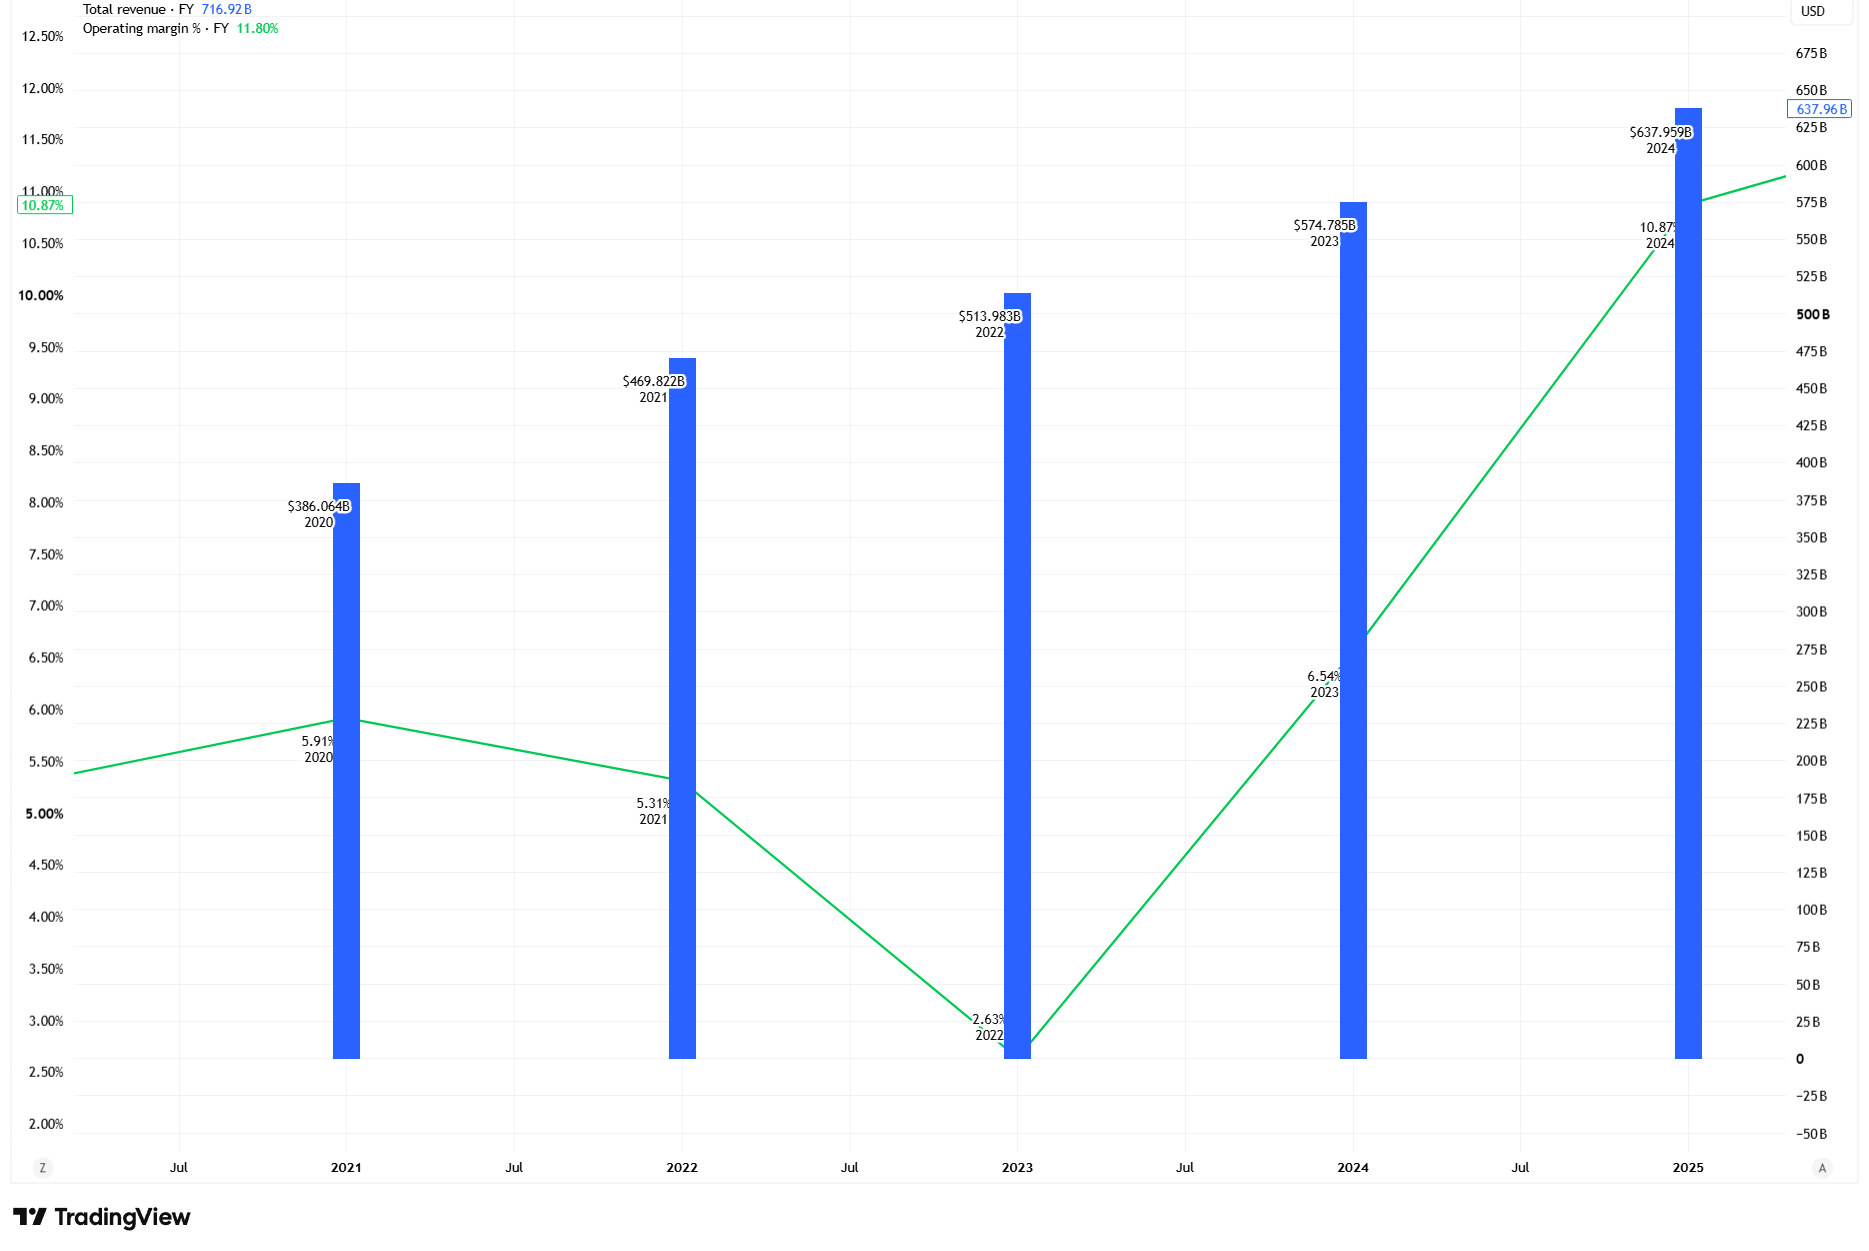
Amazon’s annual revenue increased throughout the period, from approximately $386.1 billion in 2020 to $638.0 billion in 2024. However, TradingView’s operating-margin measure fell from 5.31% in 2021 to 2.63% in 2022, showing that higher sales did not immediately produce stronger profitability. The margin subsequently recovered to 6.54% in 2023 and 10.87% in 2024 as operating performance improved. This illustrates how costs, efficiency and business mix can change the relationship between revenue and profit.
What Investors Examine Beyond Revenue
Revenue growth provides useful information about sales, but it does not reveal how much value the company retains.
Market participants may also examine gross and operating margins, operating expenses, free cash flow, capital expenditure, debt costs and the performance of individual business segments. Management guidance may help indicate whether margin pressure is expected to continue or ease.
No single measure provides a complete assessment of a company’s financial position or future performance.
Bottom Line
Rising revenue generally indicates that a company is generating more sales, but it does not guarantee stronger profitability.
Costs, business mix, investment requirements and cash conversion determine how much value the company retains. Revenue growth is therefore most informative when considered alongside profit margins, cash flow and the company’s future outlook.