Basics of Candlestick Patterns
Are you looking to get started with trading candlestick patterns but don't know where to begin? Well, you're definitely not alone. If you're new to chart analysis, learning how to read candlestick charts is one of the fastest ways to understand market behaviour. Beginner traders often feel overwhelmed when they first discover charts full of red and green bars, and they don’t know where to begin. Not to worry though, because in this article we are going to dive into how to read candlesticks individually, how to read candlestick charts and the principles to understand trading candlestick patterns, so by the end of this course, you’ll be better equipped to make smarter and more precise trading decisions. So let’s get started!
- Understanding the Candlestick when trading Candlestick Patterns
- Why trading Candlestick Patterns matter?
- How to read Candlesticks when trading Candlestick Patterns
- How to look for Patterns when trading Candlestick Patterns
- The Top 5 Bullish Candlestick Patterns you must know
- The Top 5 Bearish Candlestick Patterns you must know
- Common Mistakes to avoid when trading Candlestick Patterns
- Trading Candlestick Patterns: Best Practices when Learning
- Conclusion: Everything you need to know about trading Candlestick Patterns
Understanding the Candlestick when trading Candlestick Patterns
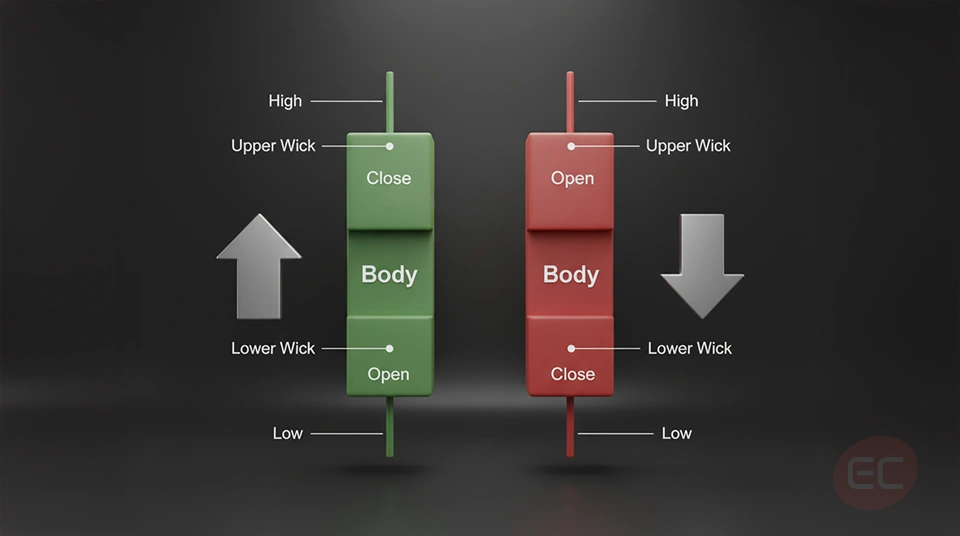
Before diving into candlestick patterns, it’s crucial to first understand what a candlestick is. When you're learning trading candlestick patterns, think of candlesticks like compact packages of price data for a specific time period.
Every Candlestick shows:
- Open price
- Close price
- High price
- Low price
When learning how to read candlesticks, it helps to first identify the candle’s body and wicks, for instance:
- A green candle (or sometimes white, depending on your chart settings) shows the price closed higher than it opened.
- A red candle (or black depending on your settings) shows the price closed lower than it opened.
- The thin lines above and below the body are called wicks, they represent the high and low prices.
It might be a lot of information at once, so if you’re still confused on how to read candlestick charts, don’t worry, understanding the basics takes a bit of time, but you’ll catch on quickly.
Why trading Candlestick Patterns matter
Why are trading candlestick patterns such a big deal? Well, because they are a reflection of market psychology. In other words, every candle tells a story of what buyers and sellers were doing during that specific time period. Let’s break it down a bit. Here’s what makes trading candlesticks so important:
1) They can help identify potential reversals
2) They can show continuation patterns
3) They can be combined with other indicators for more accuracy
4) They provide a visual edge for spotting specific opportunities
So when you really understand how to read candlesticks, you’re not just looking at the price, instead, you’re understanding emotion and momentum within the market.
Now that we’ve covered why they matter, let’s learn how to read candlesticks.
How to read Candlesticks when trading Candlestick Patterns
Let’s break down how to read candlesticks step by step, it’s actually simpler than it may look!
1) Identify the color: Is it bullish (green) or bearish (red)?
2) Look at the size of the body: A large body shows strong movement, and a small body could signal indecision.
3) Check the wicks: Long wicks mean that the price tested higher or lower levels but was rejected.
4) Understand the context: Is the candlestick part of a trend? Where is it appearing on the charts
But how do you read a whole chart full of candlesticks and where do you even start? Great question! That brings us to: how to read candlestick charts.
How to look for Patterns when trading Candlestick Patterns
When you’re learning how to read candlestick charts, you're actually looking for patterns that are repeated over a period of time. These patterns can be either bullish (indicating price may go up) or bearish (indicating price may go down).
Here’s how to look at it:
- Zoom out for a better general view and look at overall trends.
- Look for the clusters of candlesticks that form specific patterns.
- Use support and resistance levels as context.
- Combine patterns with volume indicators.
It’s important to remember that just one candlestick won’t give you the full picture. The magic of trading candlestick patterns lies in the sequences and combinations of candles over a period of time.
The Top 5 Bullish Candlestick Patterns you must know
There are a lot of candlestick patterns, but some are more reliable than others. Let’s explore the most common ones:
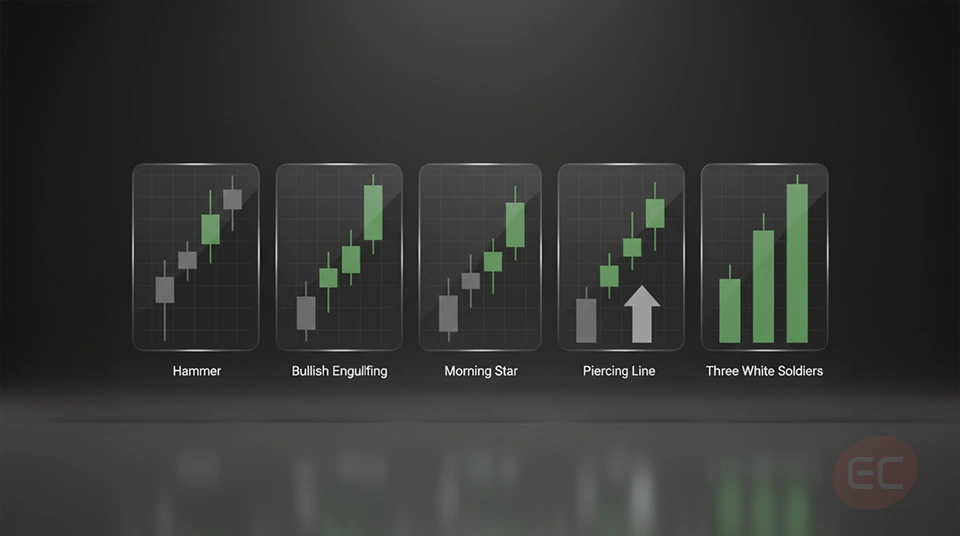
1. Hammer
- Small body, long lower wick
- Appears at the bottom of a downtrend
- Signals a potential reversal
2. Bullish Engulfing
- A small red candle followed by a large green one
- The green candle “engulfs” the previous red
- Indicates strong buying pressure
3. Morning Star
- Three-candle pattern
- Bearish candle, a doji, then a bullish candle
- Signals momentum is shifting to the bulls
4. Piercing Line
- Opens below the previous close, then closes more than halfway up the prior red candle
- A sign of buyer strength
5. Three White Soldiers
- Three strong green candles in a row
- Appears after a downtrend or consolidation
- Strong bullish trend reversal indicator
Learning how to read candlesticks like these can give you an edge in spotting trend changes early so you can make better and more informed trading decisions.
The Top 5 Bearish Candlestick Patterns you must know
Just like there are bullish patterns, there are bearish ones too that you absolutely need to know. Recognising these trading candlestick patterns can help you avoid bad decisions. Let’s dive into some of the most popular bearish candlestick patterns:
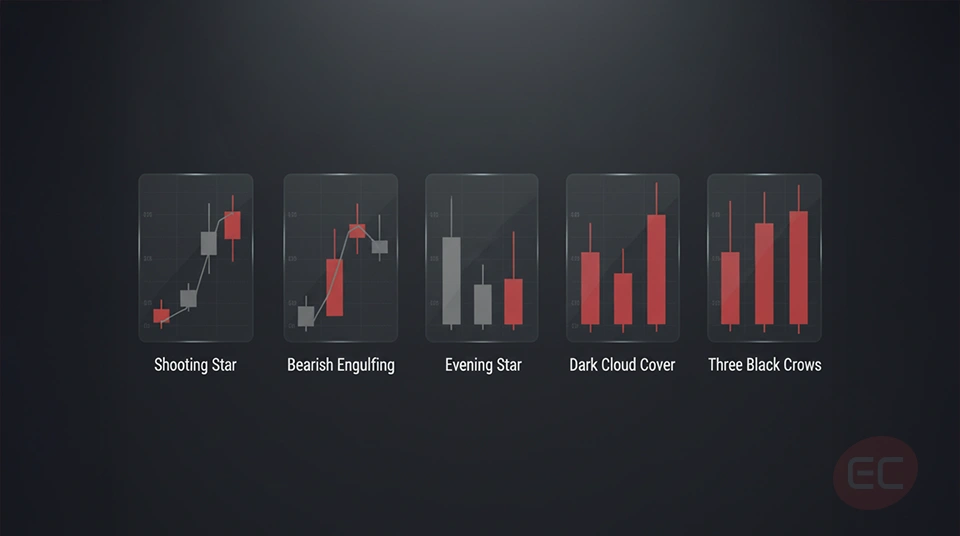
1. Shooting Star
- Small body, long upper wick
- Appears after an uptrend
- Signals a potential reversal downward
2. Bearish Engulfing
- A small green candle followed by a large red one
- The red candle “engulfs” the previous green
- Suggests strong selling pressure
3. Evening Star
- Opposite of the Morning Star
- Bullish candle, a doji, then a bearish candle
- A major trend reversal indicator
4. Dark Cloud Cover
- Bearish pattern where the red candle opens above the green one but closes below its midpoint
- Sign of buyer exhaustion
5. Three Black Crows
- Three long red candles after an uptrend
- Strong bearish signal
By understanding these candlestick patterns early, you can use it to help you exit trades before making significant losses.
Common Mistakes to avoid when trading Candlestick Patterns
Let’s be real, even highly experienced traders make mistakes, sometimes being overly confident and not learning the right materials can work against you. So being aware of the common mistakes that traders make, you can have a better chance of avoiding them.
Here are some of the most common mistakes beginners make on how to read candlestick charts:
- Relying on a single candle without context.
- Ignoring volume and trend confirmation.
- Misidentifying patterns due to inexperience.
- Not practicing proper risk management.
- Overtrading based on weak signals.
You must always remember: trading candlestick patterns is a skill that improves with time and experience. Like anything, practice makes perfect, and once you understand how it works, you can use it to your advantage.
Trading Candlestick Patterns: Best Practices when Learning
By now, you should have a clear understanding on how to read candlestick charts and recognise important candlestick patterns, but in case some things are still unclear, here are a few best practices to reinforce your learning:
- Study real charts on a daily basis, this repetition builds pattern recognition.
- Use a demo account to practice your setups without putting your own money at risk.
- Combine candlestick patterns with technical indicators such as RSI or MACD.
- Write down your trades and review your analysis to see what has worked and what didn’t work.
Are you wondering, “is this enough to start trading?” Well, the answer is yes, as long as you stay consistent and keep learning, your confidence will grow over time.
Conclusion: Everything you need to know about trading Candlestick Patterns
If you've made it this far, then congratulations! You should by now have a solid foundation in trading candlestick patterns, as well as knowing how to read candlesticks and even how to interpret candlestick patterns. We’ve covered a lot in this course, so let’s recap what you’ve learned so far:
- What candlesticks represent.
- How to read candlesticks.
- The difference between bullish and bearish candlestick patterns.
- How to approach how to read candlestick charts.
- Best practices for applying this knowledge
So what’s next? What should you do with this knowledge? Start looking at charts yourself. Analyse them. Try to identify at least five trading candlestick patterns each day and try to note down how prices reacted afterward. Remember, trading candlestick patterns are powerful, and can lead to great opportunities, but no single tool is bulletproof. Make sure to always use them with a proper trading plan and risk management strategy.
If you follow the steps covered in this course, and you understand what the common mistakes are, you already have an edge in the market. If you want to learn about more chart patterns, check out this article on Triangles, Head & Shoulders and Flags. We still have a lot more trading topics to cover at EC Academy, so keep on reading as we unlock the next trading topic.