


How to Read Candlestick Patterns (With Real-World Example)
Candlestick patterns remain one of the strongest tools available to traders who want to understand the market’s emotional pulse. Beyond showing price levels, they reveal how buyers and sellers behave at key moments and how sentiment shifts over time. In fast‑moving markets, a single candlestick can tell a more powerful story than several paragraphs of news.
This guide explains how to interpret candlestick patterns through a real and dramatic market event: the February 2026 surge in the Japanese Yen, one of the most notable currency moves of the year.
The Japanese Yen strengthened by approximately 2.9% against the US Dollar during the second week of February 2026, as traders reacted to Japan’s election outcome and increased expectations of potential Bank of Japan tightening, which contributed to an unwind of Yen carry trades.
Candlestick Patterns and Market Psychology
Each candlestick on the chart shows how the price moved during the day. The wider part of the candle shows where the market opened and closed, while the thin lines above and below it (the wicks) shows the highest and lowest prices reached.
In the chart below, the shift begins with a large red candle that takes over the previous day’s move, showing that sellers suddenly stepped in with strength. In the days that follow, several candles have noticeable upper wicks, which means the price tried to push higher but couldn’t hold those levels.
As the move continues, the daily closes keep drifting lower, showing steady selling after the February 2026 election news. Even the smaller candles in the middle simply show a short pause rather than a change in direction.
How the February 2026 Yen Rally Formed a Textbook Candlestick Reversal
USD/JPY Daily Chart – February 2026 Yen Surge and Bearish Reversal Pattern
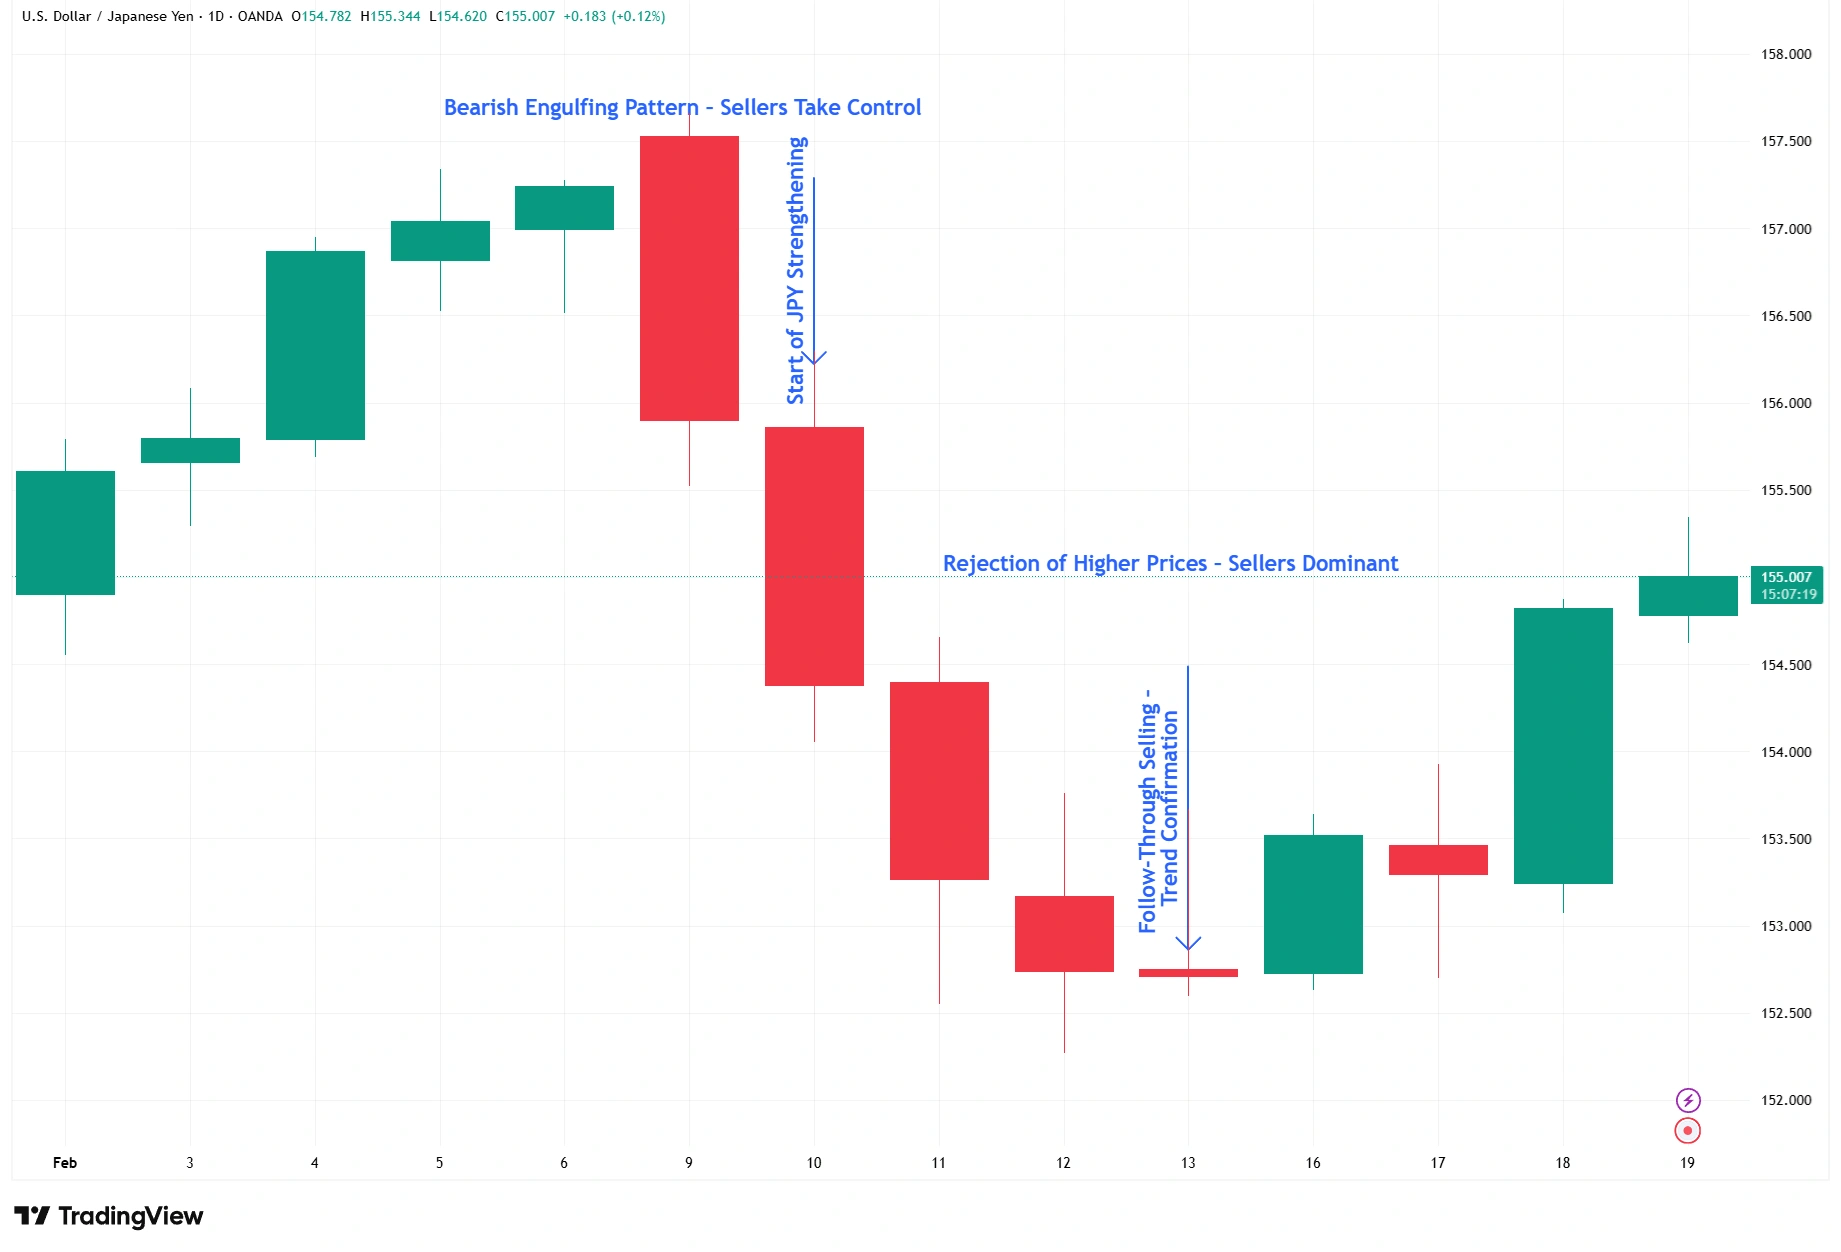
Immediately after Japan’s election results were announced, candlestick formations on USD/JPY began to reflect a noticeable shift in sentiment. Reports that week described a “huge gain printed by the Japanese Yen,” driven by political stability, equity inflows, and speculation that the BoJ would raise interest rates sooner than expected.
One of the clearest early signals was a bearish engulfing candlestick, where a large bearish candle overtakes the previous bullish candle, indicating a decisive takeover by sellers. In USD/JPY, this pattern mirrored the abrupt shift in market sentiment as traders exited short‑Yen positions. Subsequent candles closed lower, forming a clear downtrend.
Another key feature was the appearance of long upper wicks. Although some traders attempted to push the pair higher, they were consistently overpowered by selling pressure. This aligned with the broader narrative of investors repositioning for potential Japanese policy tightening. Taken together, the engulfing formations, elongated upper shadows, and consecutive lower closes visually confirmed the story unfolding in the news.
Why This Real‑World Example Matters for Traders
The February 2026 USD/JPY reversal highlights a truth that every trader eventually learns: candlestick patterns are most powerful when viewed alongside fundamental events.
A bearish engulfing pattern following a political upset and shifting rate expectations carries far more weight than one occurring in isolation. Candlesticks translate fundamental changes into visible price behaviour, often revealing shifts before headlines do.
A More Informed Way to Use Candlestick Patterns
The lesson from February 2026 is not simply that engulfing patterns or long wicks are effective.
Candlestick interpretation becomes more meaningful when the trader understands why the market is moving. In this case, heavy selling pressure on USD/JPY visually expressed a broader realignment triggered by Japan’s political landscape and anticipated policy tightening.
For traders, this underscores the importance of combining candlestick analysis with macroeconomic awareness. When both align, the result is a clearer, more confident trading signal.
Conclusion
Candlestick patterns offer traders a window into market behaviour, translating sentiment shifts into visual cues. The dramatic Yen appreciation in February 2026 shows how powerful these signals can be when combined with fundamental developments. As markets respond to elections, central bank policies, or unexpected data releases, candlesticks often present the earliest evidence of change.
At EC Markets, we encourage traders to analyse candles not in isolation but as part of a broader narrative where technical signals and real‑world catalysts work together to reveal more actionable insights.