


Basics of Candlestick Patterns
Candlestick charts are one of the most widely used tools in technical analysis. Compared to other chart types, a candlestick packs the most information into a single shape. That is why trading candlestick patterns is a skill that beginner traders commonly try to develop. Knowing how to read candlestick charts gives traders a clear idea of what the market is doing at any given moment. This article covers how to read candlesticks from the ground up, how to spot bullish and bearish patterns, and how to separate the strong signals from noise.
What is a Candlestick?
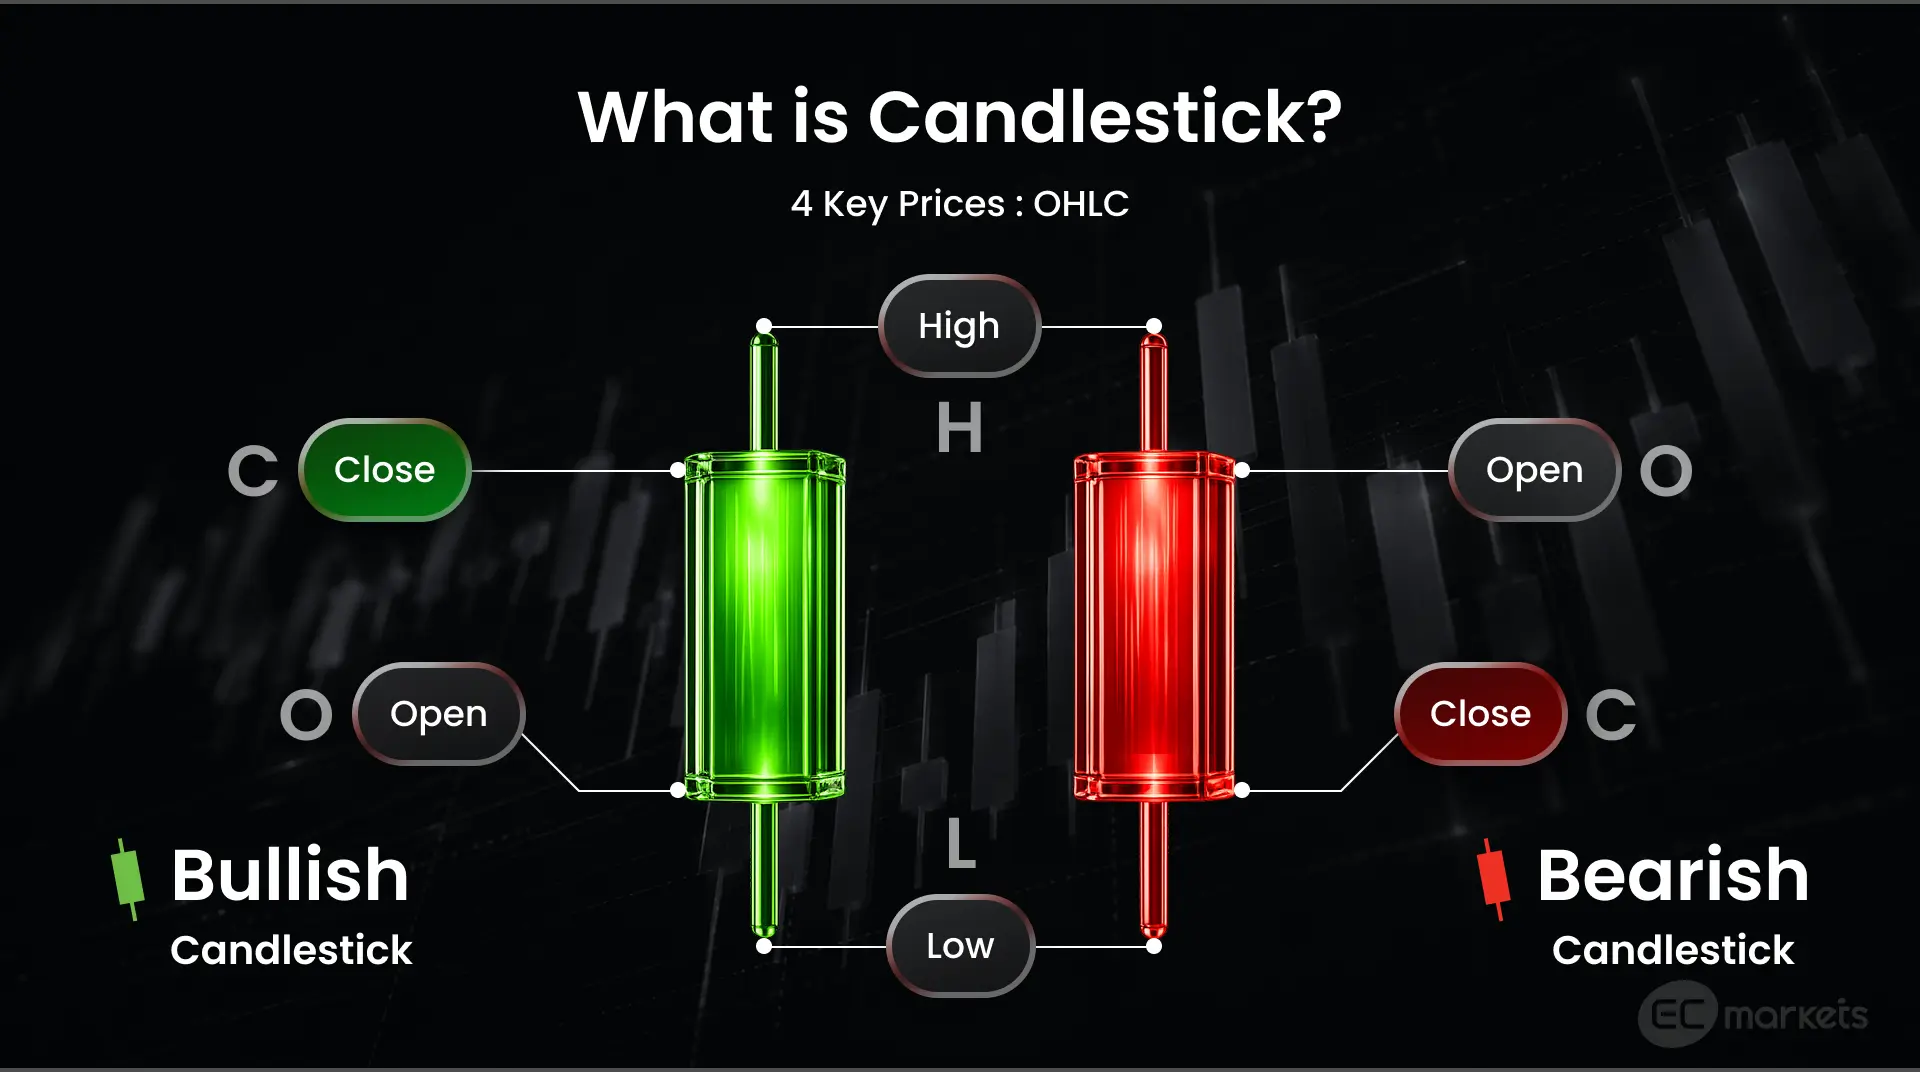
Learning how to read candlestick charts starts with understanding the four key prices on a candlestick known as the OHLC: open, high, low and close.
- Open: Where the price started.
- High: The highest price reached.
- Low: The lowest price reached.
- Close: Where the price finished.
Depending on the timeframe of the chart, each candlestick shows the OHLC prices for each period. For example, if a trader selects a timeframe of one minute, each candlestick shows the OHLC prices for each minute.
Candlesticks are made up of a ‘body’ and two ‘wicks’, which are used to show the OHLC.
The ‘body’ (or ‘real body’) is the thick part in the middle. It shows the open and close prices, as well as the direction of the movement.
- Bullish Candlestick: Closing price was higher than opening price (often green or white).
- Bearish Candlestick: Closing price was lower than opening price (often red or black).
Recognising the difference between bullish and bearish candles is one of the first steps in how to read candlesticks at a basic level.
The ‘wicks’ (or ‘shadows’) are the thin lines on either end of the body. These mark the high and low reached during the period. Long wicks indicate that although price managed to push quite far during that period, the push got rejected and turned back towards the closing price. Traders care about these rejection points as they can happen again at similar price levels, creating support and resistance zones.
How to Read Candlesticks
Knowing how to read candlestick charts goes beyond identifying each part of a candle, but also what a candlestick is suggesting about the behaviour of the market. Here are four aspects that form the foundation of how to read candlesticks in any market or timeframe.
Open and close positions - This shows who had control by the end of the session: buyers or sellers.
- A close price above the open price means buyers had control.
- A close price below the open price means sellers had control.
Location on the chart - Shape matters less without context.
- A candle in the middle of a range often means very little.
- The same candle near support or resistance carries more weight, because it acts as proof of a reaction at a meaningful level.
Body size - This reflects net progress during the period.
- Larger bodies suggest stronger directional commitment.
- Smaller bodies suggest hesitation or balance.
Wick sizes - They mark rejected prices, where price was tested but not held.
- Long wicks highlight failed pushes and potential turning points.
Looking at the body and wicks together can tell a story. A small body with long wicks on both sides suggests a ‘tug of war’, meaning a lot of back and forth between buyers and sellers with neither side winning. On the other hand, a large body with no wicks suggests the complete opposite, with one side dominating the period from open to close. These visual cues are the absolute basics of how to read candlestick charts at a glance.
Advantages of Knowing How to Read Candlestick Charts
Candlestick charts are popular for their information-dense format, which is helpful when making trading decisions and executing with precision. Understanding how to read candlestick charts and identify patterns benefits traders by enabling them to:
- Analyse the full price journey. Reading a line chart is easy as it only plots closing prices, providing a general trend. However, knowing how to read candlestick charts gives traders a better idea of how steady or volatile each move was.
- Judge the strength of a move. An important part of learning how to read candlesticks is noticing where the close price sits in relation to the candlestick’s total range (high to low). This can provide a read on conviction: a close near either extreme signals a strong move, while a close near the midpoint signals a weak one.
- Spot acceptance or rejection. At key levels (support and resistance), a long wick signals rejection – price reached the level but failed to push past it. On the other hand, a large body that closes past the level signals acceptance, which suggests price is likely to continue in that direction.
- Get a read on volatility. The ability to analyse the shape of a candlestick is a key benefit of knowing how to read candlestick charts compared to other chart types. The size of a candlestick’s body in relation to its wicks reveals market stress: large bodies with small wicks indicate a high-momentum move, whereas small bodies with long wicks point to more back and forth between buyers and sellers.
Five Common Bullish Candlestick Patterns
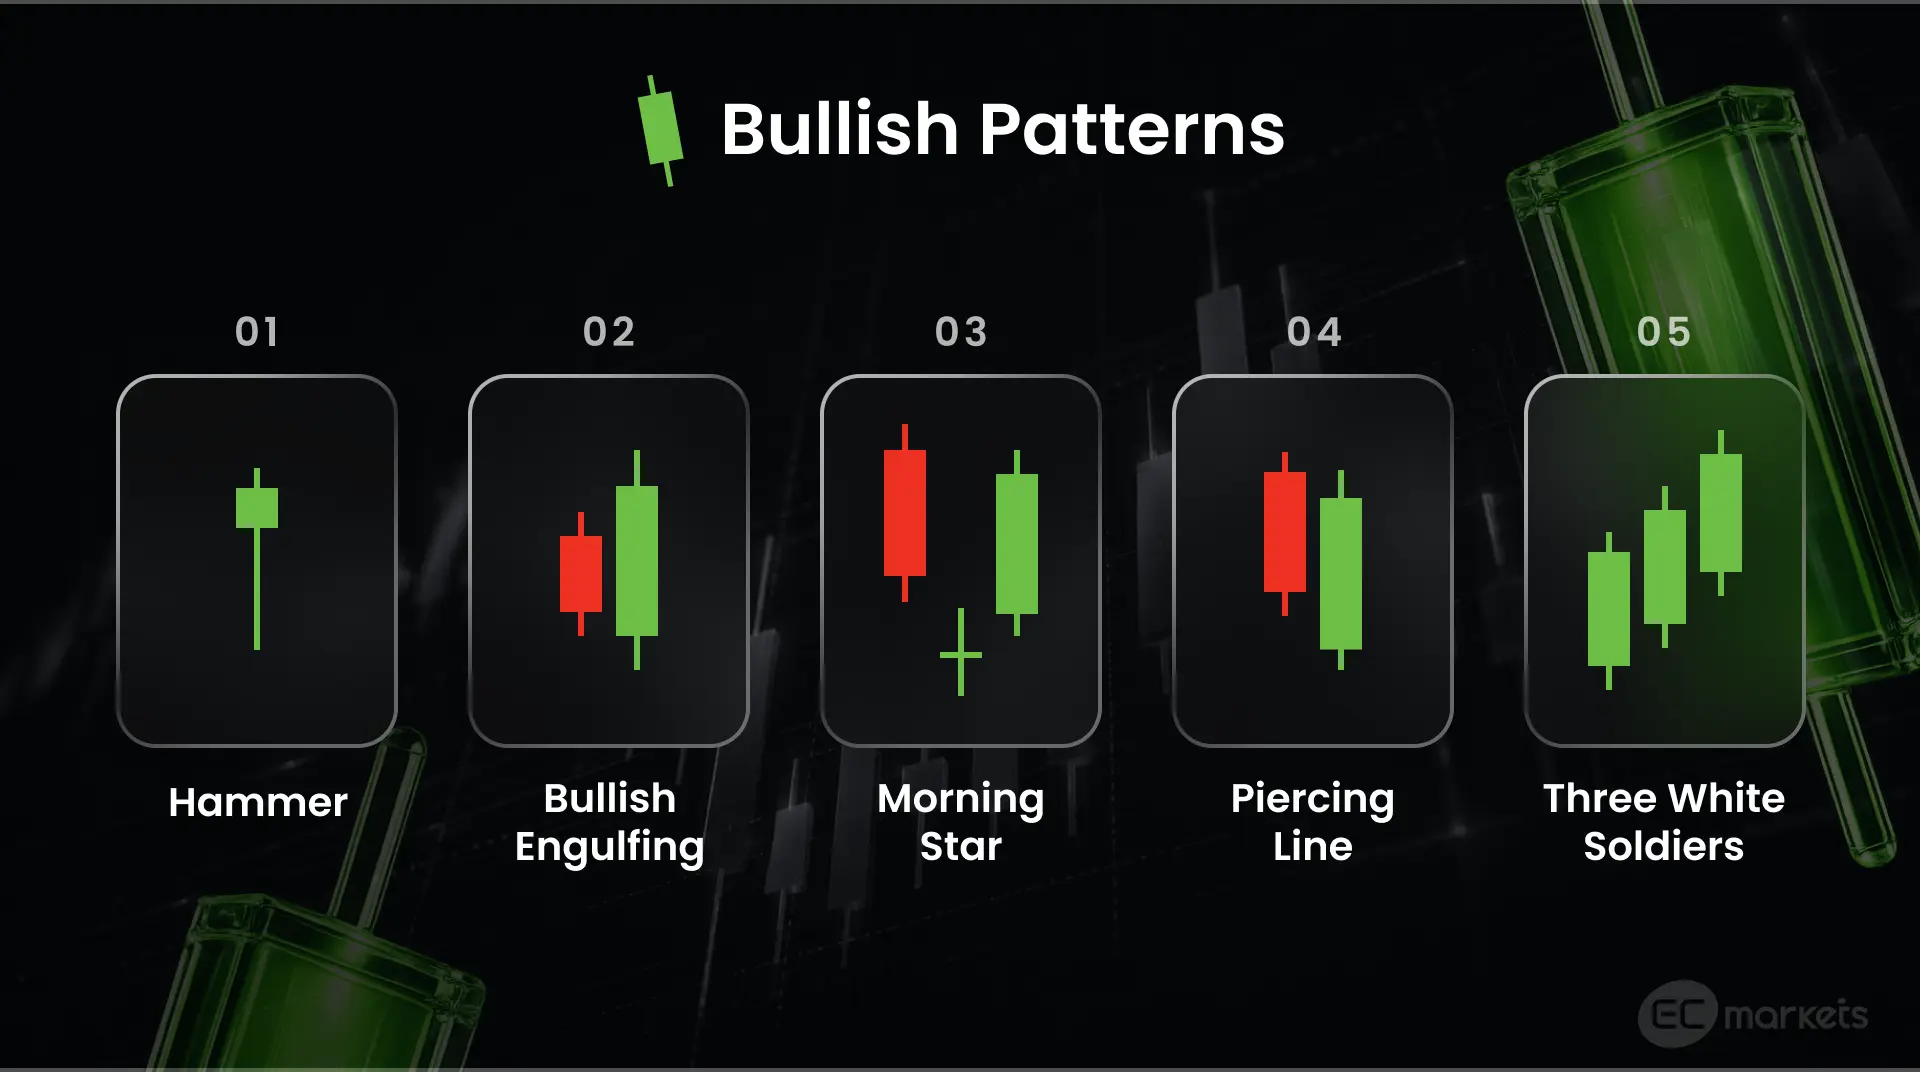
When trading candlestick patterns, bullish formations are signals worth noting because they may suggest that selling pressure is fading and that buying pressure is rising. In other words, a downward price trend may reverse and start moving upwards. Below are some bullish patterns to look out for. Each builds on the basics of how to read candlesticks by combining one or more candles into a recognisable formation.
Hammer
- One candle with a small body and a long lower wick.
- This shows that selling pressure caused prices to drop during the period, but buyers had enough strength to reject the drop, causing prices to move back up to close.
- A hammer, especially near support or after a clear decline, can be an early sign that downside is getting harder to extend.
Bullish Engulfing
- Two candles: a bearish candle, then a bullish candle that closes higher with its body covering the prior candle's body.
- When this pattern forms, especially after a long downtrend or at a known support level, it suggests a shift in control in which sellers lose momentum and buyers gain it.
Morning Star
- Three candles: a strong bearish candle, then a smaller ‘pause’ candle, followed by a strong bullish candle.
- The story being told: selling pressure → hesitation → buying pressure.
- Many traders pay attention to how far the third candle's close climbs back up into the first candle's range. The higher it closes, the more of the original selling has been undone in a single period, which signals stronger buying conviction and a more convincing shift in control.
Piercing Line
- Two candles: a bearish candle, then a bullish candle that opens lower than the prior candle’s close and closes higher than the midpoint of the prior candle.
- When this happens, especially near support and when the rebound looks clean, it suggests that sellers had an early advantage but could not hold it.
Three White Soldiers
- Three consecutive bullish candles, each with higher closes, often after a downtrend.
- This signals that buyers are gaining strong momentum and taking control after a period of selling.
- This pattern is more meaningful when there is room for price to keep running, rather than when a known resistance level sits just above. Without room, price will likely stall even if the sequence is strong.
Five Common Bearish Candlestick Patterns
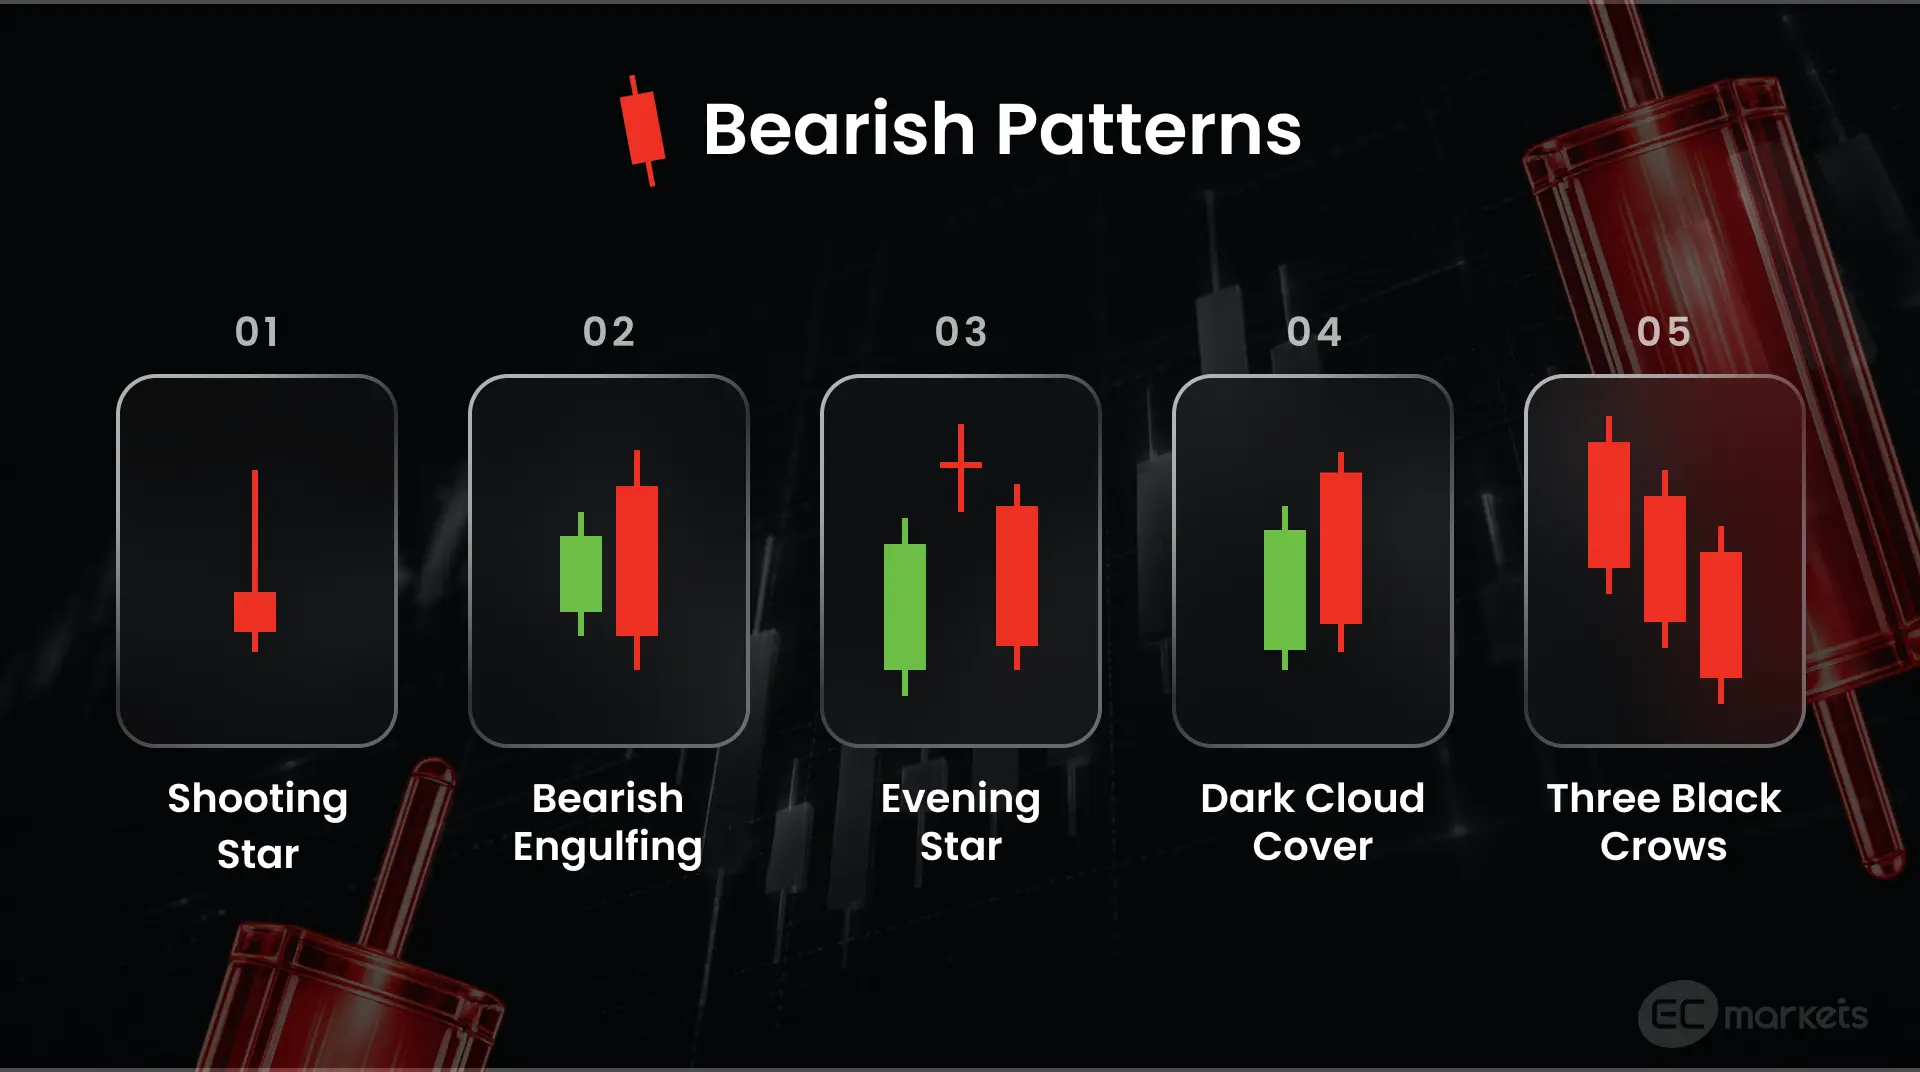
On the other hand, bearish formations are just as important when trading candlestick patterns. These patterns may suggest that buying pressure is fading and that selling pressure is rising. That means price that was on an upward trajectory may reverse and begin to move downwards. Catching these early signs is one of the practical payoffs of knowing how to read candlestick charts at resistance. Here are some bearish patterns to look out for:
Shooting Star
- One candle with a small body and a long upper wick.
- The long upper wick shows that buyers pushed the price up, but sellers were strong enough to reject the push. Near resistance, this may be an early sign that upward momentum is becoming harder to sustain.
Bearish Engulfing
- Two candles: a bullish candle, then a bearish candle that closes lower with its body covering the prior candle's body.
- When this pattern forms, especially after a long uptrend or at a known resistance level, it suggests a shift in control in which buyers lose momentum and sellers gain it.
Evening Star
- Three candles: a strong bullish candle, then a smaller 'pause' candle, followed by a strong bearish candle.
- The story being told: buying pressure → hesitation → selling pressure.
- Traders typically pay the most attention to how much the third candle reverses in relation to the first candle. A strong reversal may suggest that sellers have decisively taken control and momentum has shifted downwards.
Dark Cloud Cover
- Two candles: a bullish candle, then a bearish candle that opens higher than the prior candle's close and closes below the midpoint of the prior candle.
- When this happens, especially near resistance and when the drop looks clean, it suggests that buyers had an early advantage but could not keep it.
Three Black Crows
- Three consecutive bearish candles, each with lower closes, often after a downtrend.
- This signals that sellers are gaining strong momentum and taking control after a period of buying.
- This pattern is more meaningful when there is room for price to keep falling, rather than when a known support level sits just below. Without room, price will likely stall even if the sequence is strong.
How to Analyse Candlestick Patterns
When trading candlestick patterns, it is worth remembering that they are not 'magic signals'. Knowing how to read candlesticks properly means recognising that patterns are only significant when multiple factors align, beyond the pattern showing up. The two checks below help filter strong setups from weak ones.
Check 1: Where is the pattern forming?
Is the candle at a meaningful support or resistance level, or in the middle of nowhere?
A hammer or engulfing candle has far more weight when it forms at a well-defined support or resistance area. These key levels are where major institutions tend to act, and since their orders are what actually move price, trading candlestick patterns at these levels gives traders a chance to catch a meaningful move. For example, at a clear resistance level, an institution is likely to sell, and a sell order of this size will be enough to drive price down. This is why a long upper wick at resistance carries weight — it is visual evidence of that institutional selling pushing price back from the level. Expert traders who know how to read candlesticks can recognise that a pattern that forms in the middle of a range with no obvious level nearby is more likely to reflect random short-term price movement rather than a genuine shift in control between buyers and sellers.
Check 2: What does the higher timeframe show?
Is the broader market trending, ranging (moving sideways), or shifting between the two?
Understanding how to read candlestick charts across multiple timeframes is more valuable than reading any single one in isolation. Lower timeframes (such as 5-minute or 15-minute) show short-term detail, while higher timeframes (such as 1-hour, 4-hour or daily) show the broader market direction. If the higher timeframe is in a strong trend, any reversal pattern that forms on the lower timeframe is likely fighting against that trend, and trends are usually driven by larger institutional flows that smaller signals cannot easily overcome. When trading candlestick patterns in these conditions, what looks like a reversal on the 5-minute chart often turns out to be a brief pullback (a small temporary move against the trend) rather than a genuine turning point. This is why successful traders who have spent time learning how to read candlesticks always check what the higher timeframe is doing before committing to a setup on a lower timeframe.
Tip for beginners:
The goal of trading candlestick patterns is not to 'predict' the next candle and trade every pattern spotted. Instead, it should be to build a repeatable filter. Experienced traders who know how to read candlesticks realise that patterns do not guarantee reversals. They merely serve as hints at what may come next. Before making a decision, traders should ensure they:
- Check the context first by confirming the chart location and looking at the overall trend to decide whether the current price level sits near support or resistance. Knowing how to read candlestick charts properly takes more than memorising shapes — it means understanding the story each candle tells.
- Wait for confirmation. This means waiting for follow-through to see if the next candle will continue the move or if price will break above a nearby structure point, such as a recent swing high or resistance level.
- Define the risk. A crucial part of trading candlestick patterns is to establish the invalidation level (the price at which the pattern is proven wrong and the trade idea no longer holds) and have an exit plan before risking capital.
Over time, the discipline of sticking to a plan when trading candlestick patterns matters more than hunting for perfect candles.
Conclusion | Basics of Trading Candlestick Patterns
The fundamentals of how to read candlesticks apply to any market, from forex to stocks to commodities. After a bit of practice, spotting a candlestick pattern is easy. The harder part is knowing which ones to ignore, because not every pattern is a guaranteed trade signal. The moral of the story when trading candlestick patterns is that they are not to be read in isolation. Knowing how to read candlesticks individually is only useful when paired with the broader skill of how to read candlestick charts as a whole — patterns need context for traders to tell the difference between a low- and high-conviction signal. Overall market direction and proximity to key levels are what give patterns context. Trading candlestick patterns successfully comes from combining the right pattern with the right location, the right market context and a clearly defined plan, and that discipline is what separates consistent traders from those who simply chase shapes.