S&P 500: Is the Rally Losing Momentum?
The S&P 500 remains in an uptrend over the longer term, but recent price behaviour shows signs that momentum has been cooling. The chart illustrates this clearly: the index has struggled to make meaningful new highs since late January, and the decline through March shows a shift toward slower, more uneven price action.
Technical analysis does not predict the future. Instead, it helps traders understand the strength of a current move. Signals such as RSI behaviour, the spacing between highs and the depth of pullbacks can indicate whether an established trend is maintaining its pace or beginning to slow.
Trend Structure and Price Behaviour
S&P 500: Price Pullback and Momentum Cooling
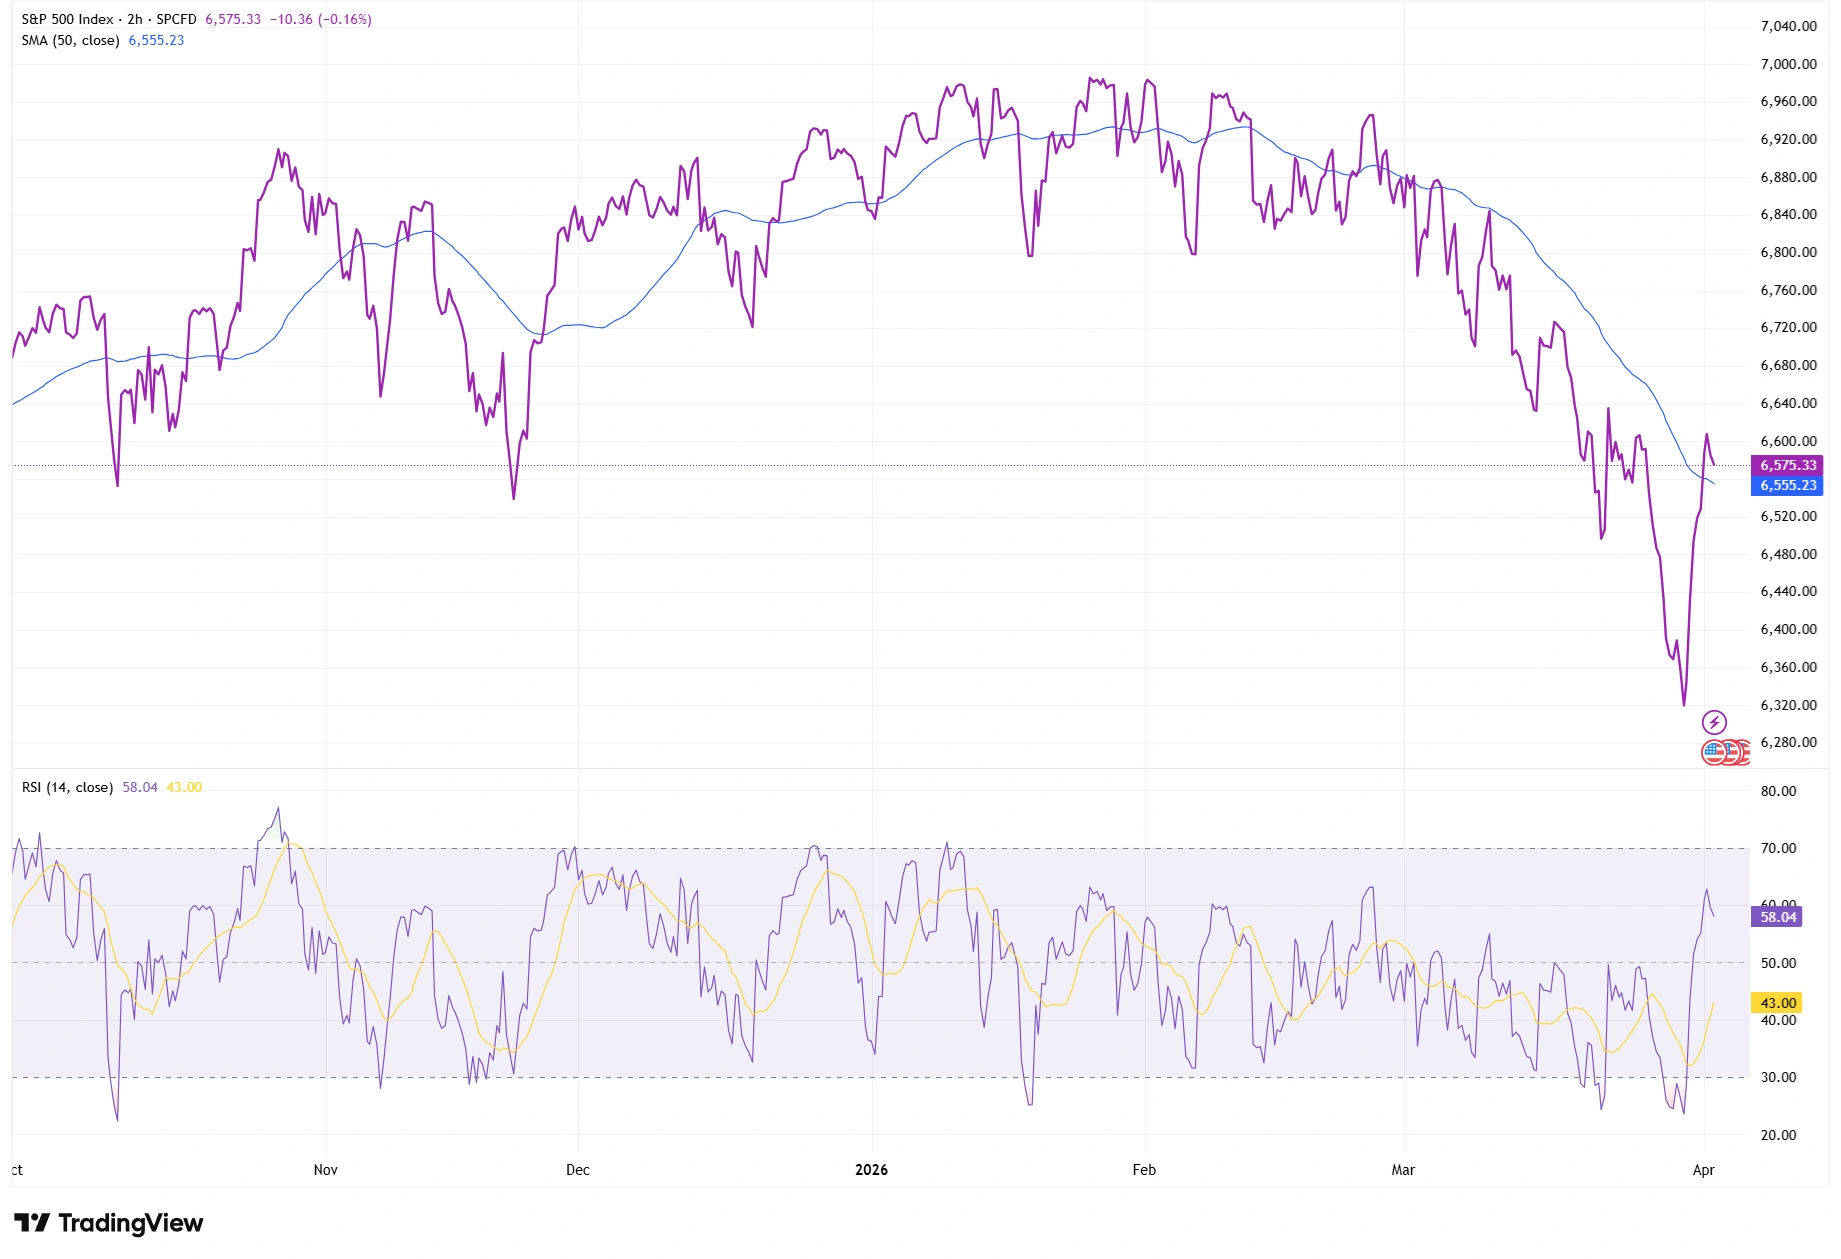
Source: TradingView. Past performance is not a reliable indicator of future performance. Data as of 2 April 2026.
On the chart, the S&P 500 shows a clear higher‑highs pattern through the end of January. After that, the index begins forming progressively lower highs, particularly visible around mid‑February and early March. Each rally attempt peaks slightly below the prior swing high, which suggests that buying pressure is becoming less aggressive.
The decline into late March is steep, with the index falling decisively below the short‑term moving average shown on the chart. Although the long‑term trend structure remains intact, the character of recent price action is different from the smoother, stronger rises seen in the last quarter of 2023.
At the far right of the chart, the index rebounds sharply. This rebound helps preserve the broader uptrend, but the recovery has not yet erased the lower‑high structure built earlier in the year.
RSI and Momentum Signals
The chart includes a 14‑period RSI, which provides clear evidence of cooling momentum.
Throughout the October-January phase, RSI frequently pushed above 60 and occasionally toward 70. In contrast, during February and March the RSI peaks are noticeably lower, often stalling around the 50-55 zone. This shows that even when price made small rally attempts, momentum did not fully confirm them.
During the late‑March sell‑off, RSI dropped toward oversold levels before turning higher with the price rebound. However, even after the bounce, RSI sits near the mid‑range around 45-50, indicating that momentum has not yet regained the strength seen earlier in the trend.
This behaviour aligns with classic bearish divergence characteristics: weaker RSI highs despite price trying to recover. Such divergence often precedes periods of sideways consolidation rather than immediate reversals.
Momentum Compression
The chart also shows signs of momentum compression across February and early March:
- Candlesticks become smaller and more overlapping.
- Rallies lose follow‑through, producing only short-lived pushes higher.
- The upward slope of the trend moderates compared with the strong advance seen earlier.
This shift reflects a more balanced tug‑of‑war between buyers and sellers. Compression often occurs when a trend slows and participants wait for new catalysts.
While compression does not guarantee a reversal, it often precedes a wider consolidation range, something consistent with the structure seen on this chart.
Pullbacks and Trend Strength
The pullback in mid‑December was shallow and quickly recovered, typical of a strong trend. In contrast, the March pullback is deeper and more persistent, with price breaking below the moving average shown on the chart.
A deeper pullback indicates that more participants are taking profits or reducing exposure, and that buyers are not stepping in as quickly as before.
The late‑March rebound is notable, the chart shows a sharp upward swing off the lows, but traders will be watching whether price can reclaim prior resistance levels rather than stall beneath them again, as it did in February.
Takeaway
The chart suggests that while the longer‑term uptrend in the S&P 500 remains intact, momentum has softened:
- Recent highs are lower than earlier ones.
- RSI has not confirmed price rallies and has remained mostly below 60.
- Momentum compression developed through February and early March.
- The March pullback was deeper than earlier corrections.
If the index continues to hold above support and RSI stabilises above the mid‑range, the trend may resume after a consolidation period. If highs continue to weaken, the market may remain range‑bound while traders reassess broader conditions.