Gold Holds Above $3,700: Can the Rally Continue?
Gold has pulled off something traders have been talking about for weeks – it’s finally crossed the $3,700 mark. It even tagged a fresh high near $3,703 before easing back slightly, and for now it’s holding in that $3,680-$3,700 pocket. The run’s been helped along by a softer US dollar, sliding bond yields, and that steady hum of safe-haven demand that tends to show up whenever the macro picture looks shaky.
It’s been an impressive climb, but it does raise the obvious question: is there still fuel in the tank, or is this where the rally takes a breather?
RSI, MACD and Volume
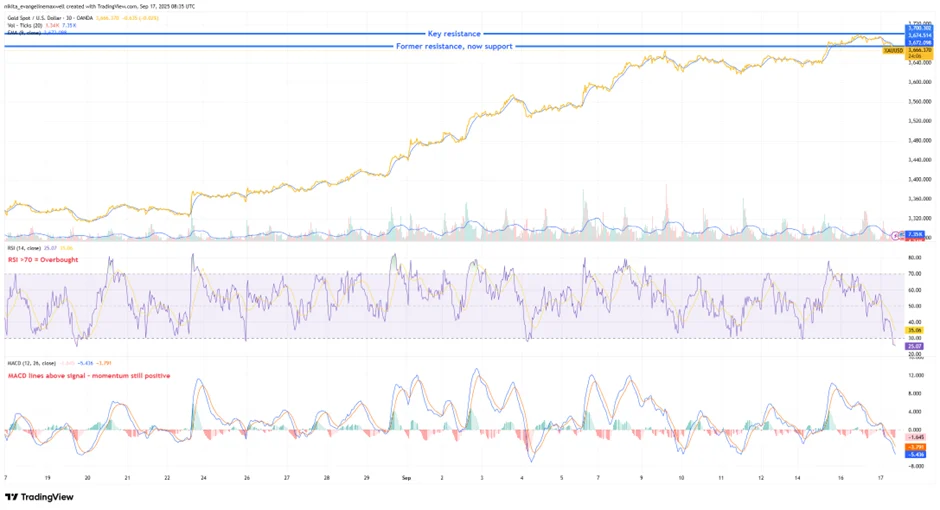
If you pull up the daily or even the 4H chart, it’s hard to argue with the trend. Price is comfortably above all the usual moving averages – the 21-period on the 4H sits near $3,652 and has acted like a springboard every time price has dipped. The 50-day EMA is way back near $3,520, the 200-day even lower around $3,220, which just shows how far this leg has stretched. The breakout over $3,675 has turned that old ceiling into short-term support, while the next line the market’s eyeing is obviously $3,700.
Momentum-wise, though, things are getting warm. The RSI on the daily chart is parked in the mid-70s, which is comfortably overbought territory. The 14-day reading has been oscillating between 73 and 77, which is usually about the point where gold takes a pause, if history’s anything to go by. That doesn’t mean a sell-off is around the corner, but it does hint the rally might be running near top gear. The MACD is still supportive – lines are stacked bullishly on both the 4H and daily, and the histogram’s holding green – so momentum hasn’t rolled over yet.
Gold’s Bull Flag Breakout Toward $3,700

Source: TradingView. All indices are total return in US dollars. Past performance is not a reliable indicator of future performance. Data as of 17 September 2025.
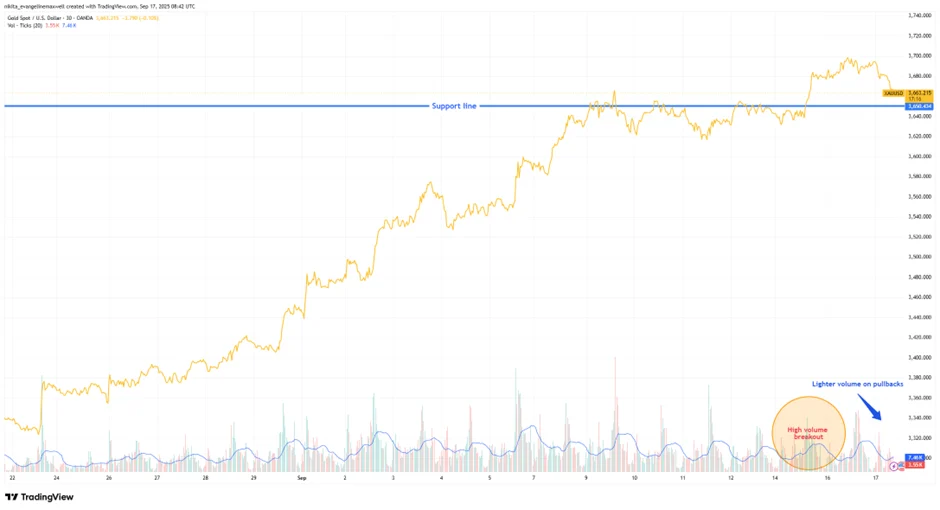
Volume’s also played its part. The breakout above that $3,650 range came on noticeably heavier turnover, which is what you want to see if you’re bullish – it shows actual buying interest, not just a lack of sellers. The dips, by contrast, have been quiet volume-wise, which suggests profit-taking rather than a rush for the exits. That mix – high volume on rallies, light on pullbacks – is a pretty healthy sign.
Gold’s High Volume Confirmed the Breakout
Source: TradingView. All indices are total return in US dollars. Past performance is not a reliable indicator of future performance. Data as of 17 September 2025.
Momentum & Pattern Watch
One pattern that stood out on the 4H chart was a neat little bull flag. Price drifted lower in a tight channel, then exploded out of it and ran right into the $3,700 zone. That flag measured almost perfectly, which is usually a good confirmation that trend-following flows are still behind the move. The structure overall still screams “uptrend”: higher highs, higher lows, no major cracks.
Gold’s Rally Stretching Far Above Key Averages
Source: TradingView. All indices are total return in US dollars. Past performance is not a reliable indicator of future performance. Data as of 17 September 2025.
There are a few early caution signs, though. A recent 4H candle printed something close to a hanging man right around $3,700, which sometimes pops up when buyers are getting tired. And given how stretched RSI is, it’s no surprise to see a few traders taking some profits. Gold did dip briefly to around $3,680 after tagging $3,703, but every time price has sagged, fresh bids have appeared almost instantly. That’s kept pullbacks shallow, which in itself says plenty about underlying demand.
RSI and MACD are still working in the bulls’ favour. If RSI keeps making lower highs while price pushes higher, that would be a red flag for divergence – but it hasn’t happened yet. MACD hasn’t shown any bearish crossovers either. If price clears $3,700 cleanly and holds it, the next logical levels are $3,730, $3,750, maybe even $3,800 if momentum really stretches. If it can’t, though, a double-top could form and drag it back towards $3,650 or $3,600. A flattening 21-period MA on the 4H would tell you the trend’s running out of steam – right now it’s still pointing up.
Risks and What Traders Are Watching
The big risk is timing. Everyone’s watching the Fed meeting. A 25bp rate cut is baked in, and that expectation has helped drive gold higher. If the Fed sounds less dovish than markets hope, it could spark profit-taking and push gold back under $3,650. A sharp rebound in the dollar or a spike in yields would have the same effect. Flip that around: if the Fed doubles down on dovish guidance, gold could easily get another push toward $3,800.
Bottom Line
Gold’s run above $3,700 has been fast, clean, and well-backed by momentum, but it’s also getting stretched. The trend’s still pointed up, yet the market’s clearly at a make-or-break level. A sustained break above $3,700 could open the door to $3,730-$3,750, while failure might trigger a pullback to $3,600. Right now, the burden’s on the bulls to keep the momentum alive.