Big Banks on the Charts: How to Trade Financial Stocks Technically
Big global banks like JPMorgan, Deutsche Bank, and HSBC aren’t just cornerstones of the financial system – they’re also playgrounds for technical traders. Billions of dollars flow through these names every day, and their charts often give you a heads-up before the actual headlines do. Candlestick patterns and trading volume are especially revealing. The question is simple: are we seeing genuine buying pressure, or just a weak push that won’t last? A quick glance at the candles and volume bars can often give you that answer. And let’s be honest, if you’re trading bank stocks, you’d rather know whether a move is worth following or just noise.
How It Works (Candlesticks & Volume 101)
Candlesticks have been around for a long time, but they remain one of the clearest ways to read price action. Each candle tells a little story about who’s in control. A big green body? Buyers won. A heavy red candle? Sellers took charge. Long wicks show rejection, tiny bodies show indecision.
Volume is just as important. It tells you how many shares were traded and, by extension, how much conviction was behind the move. A 3% rise on heavy volume means a lot more than the same rise on low volume. If HSBC rallies on double its average volume, that’s serious interest. If it moves the same amount on thin volume, many traders shrug and move on. To be fair, not every spike in volume matters. Sometimes markets are noisy, but most of the time, volume is the difference between a move that sticks and one that fades.
Where it gets really interesting is when you put the two together. A candlestick by itself might hint at a breakout or reversal, but volume tells you if it has legs. A hammer on low volume? Maybe just a blip. The same hammer on huge volume? Now that’s worth paying attention to.
Practical Application
Alright, let’s get into the banks.
JPMorgan (JPM): Imagine JPM grinding higher for weeks. Then suddenly a bearish engulfing candle forms at a high – that’s when a red candle fully swallows the green one before it. By itself, it’s a warning. But when it happens on volume 50% above normal, you’ve got conviction behind it. Institutions are selling, and that’s rarely bullish. Sure enough, those setups often lead to price drifting lower. On light volume, though? Traders might dismiss it as just noise.
JPMorgan – Bearish Engulfing on High Volume
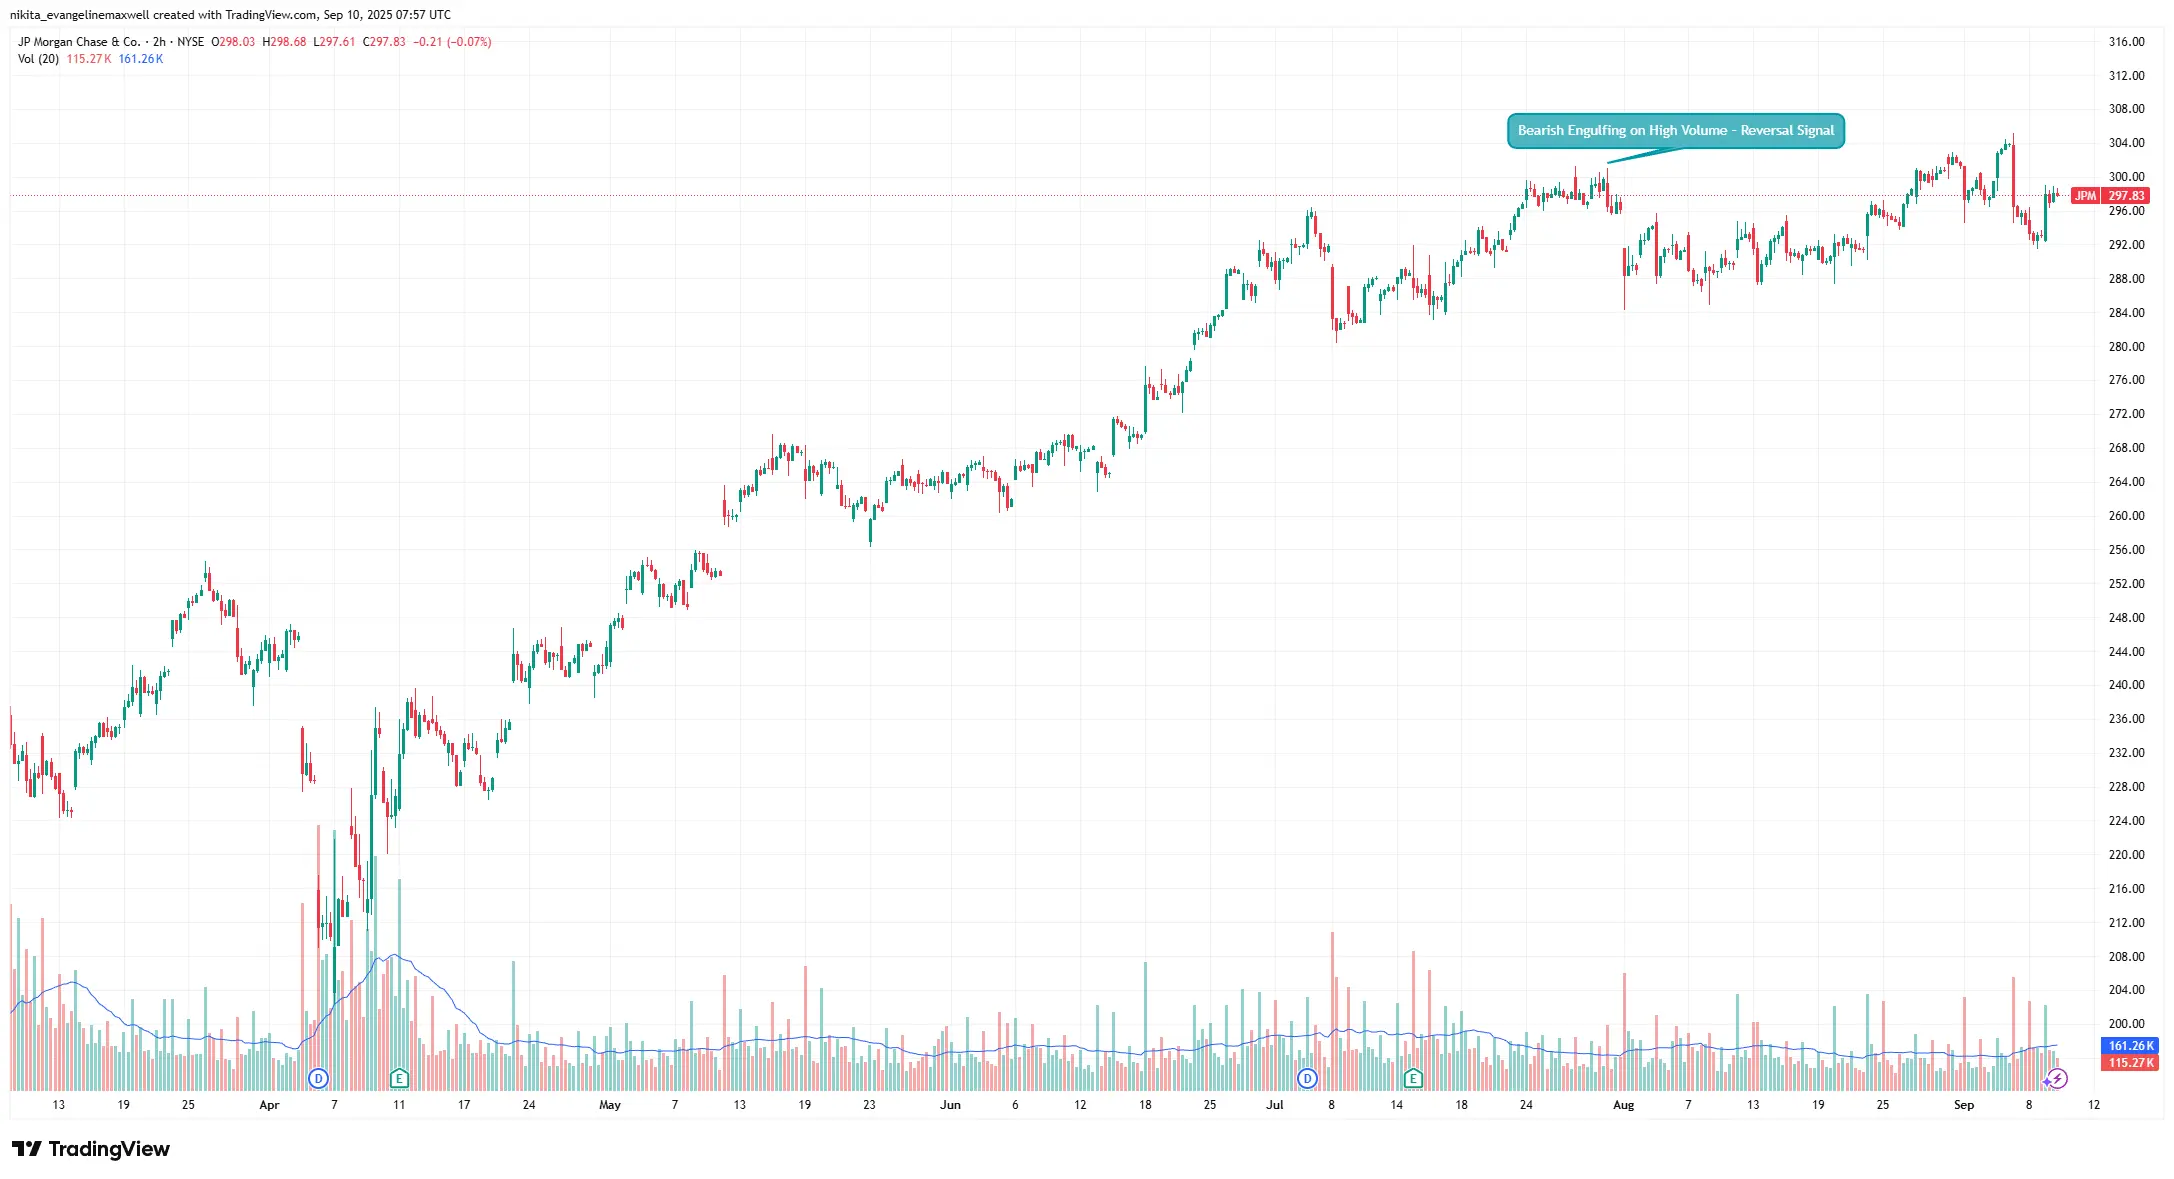
Source: TradingView. All indices are total return in US dollars. Past performance is not a reliable indicator of future performance. Data as of 10 September 2025.
A classic bearish engulfing candle, backed by heavy volume, flagged a potential reversal after an extended rally.
Deutsche Bank (DB): This stock has a history of big swings. Picture DB bouncing with a hammer candle – looks bullish on the surface. But if volume is weak, the bounce might not last. Price often drifts or retests lows. On the other hand, think about a capitulation day: huge red candle, record-breaking volume. Everyone’s dumping. Ironically, that can mark a bottom, because most sellers are flushed out. The tricky part is spotting the difference in real time – and that’s where watching volume spikes alongside candles helps.
Deutsche Bank – Capitulation vs. False Bounce
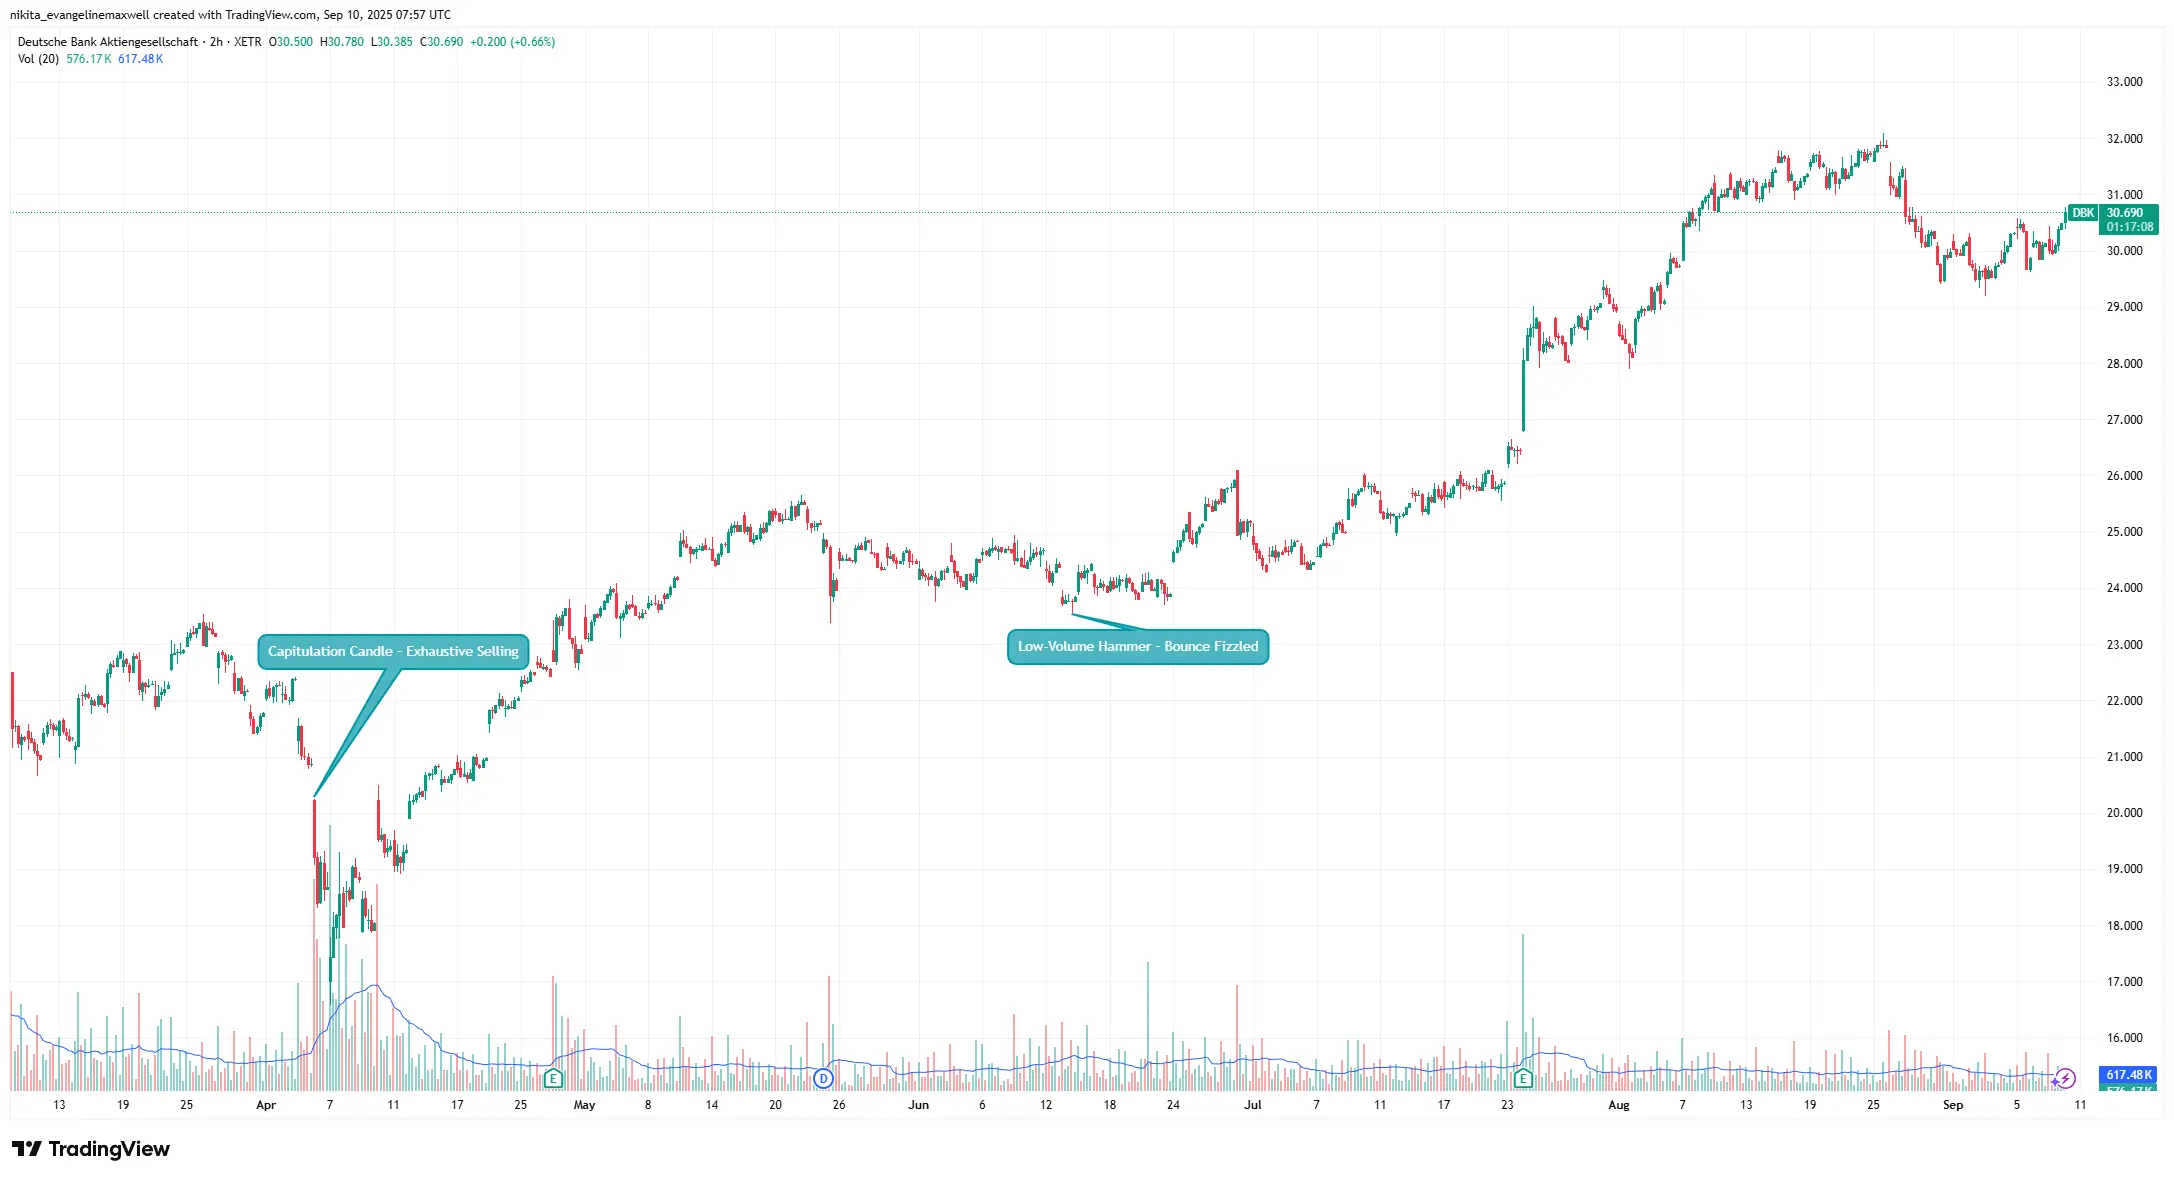
Source: TradingView. All indices are total return in US dollars. Past performance is not a reliable indicator of future performance. Data as of 10 September 2025.
A capitulation candle on extreme volume marked a bottom, while a later hammer bounce on low volume fizzled quickly.
HSBC: HSBC often sits under clear resistance zones. A breakout candle above resistance looks good, but the real test is the volume bar. On high volume – say twice the average – breakouts tend to stick. On thin volume, they’re often bull traps. Time and again, HSBC shows that without volume, a breakout doesn’t have staying power.
HSBC – Breakouts Need Volume
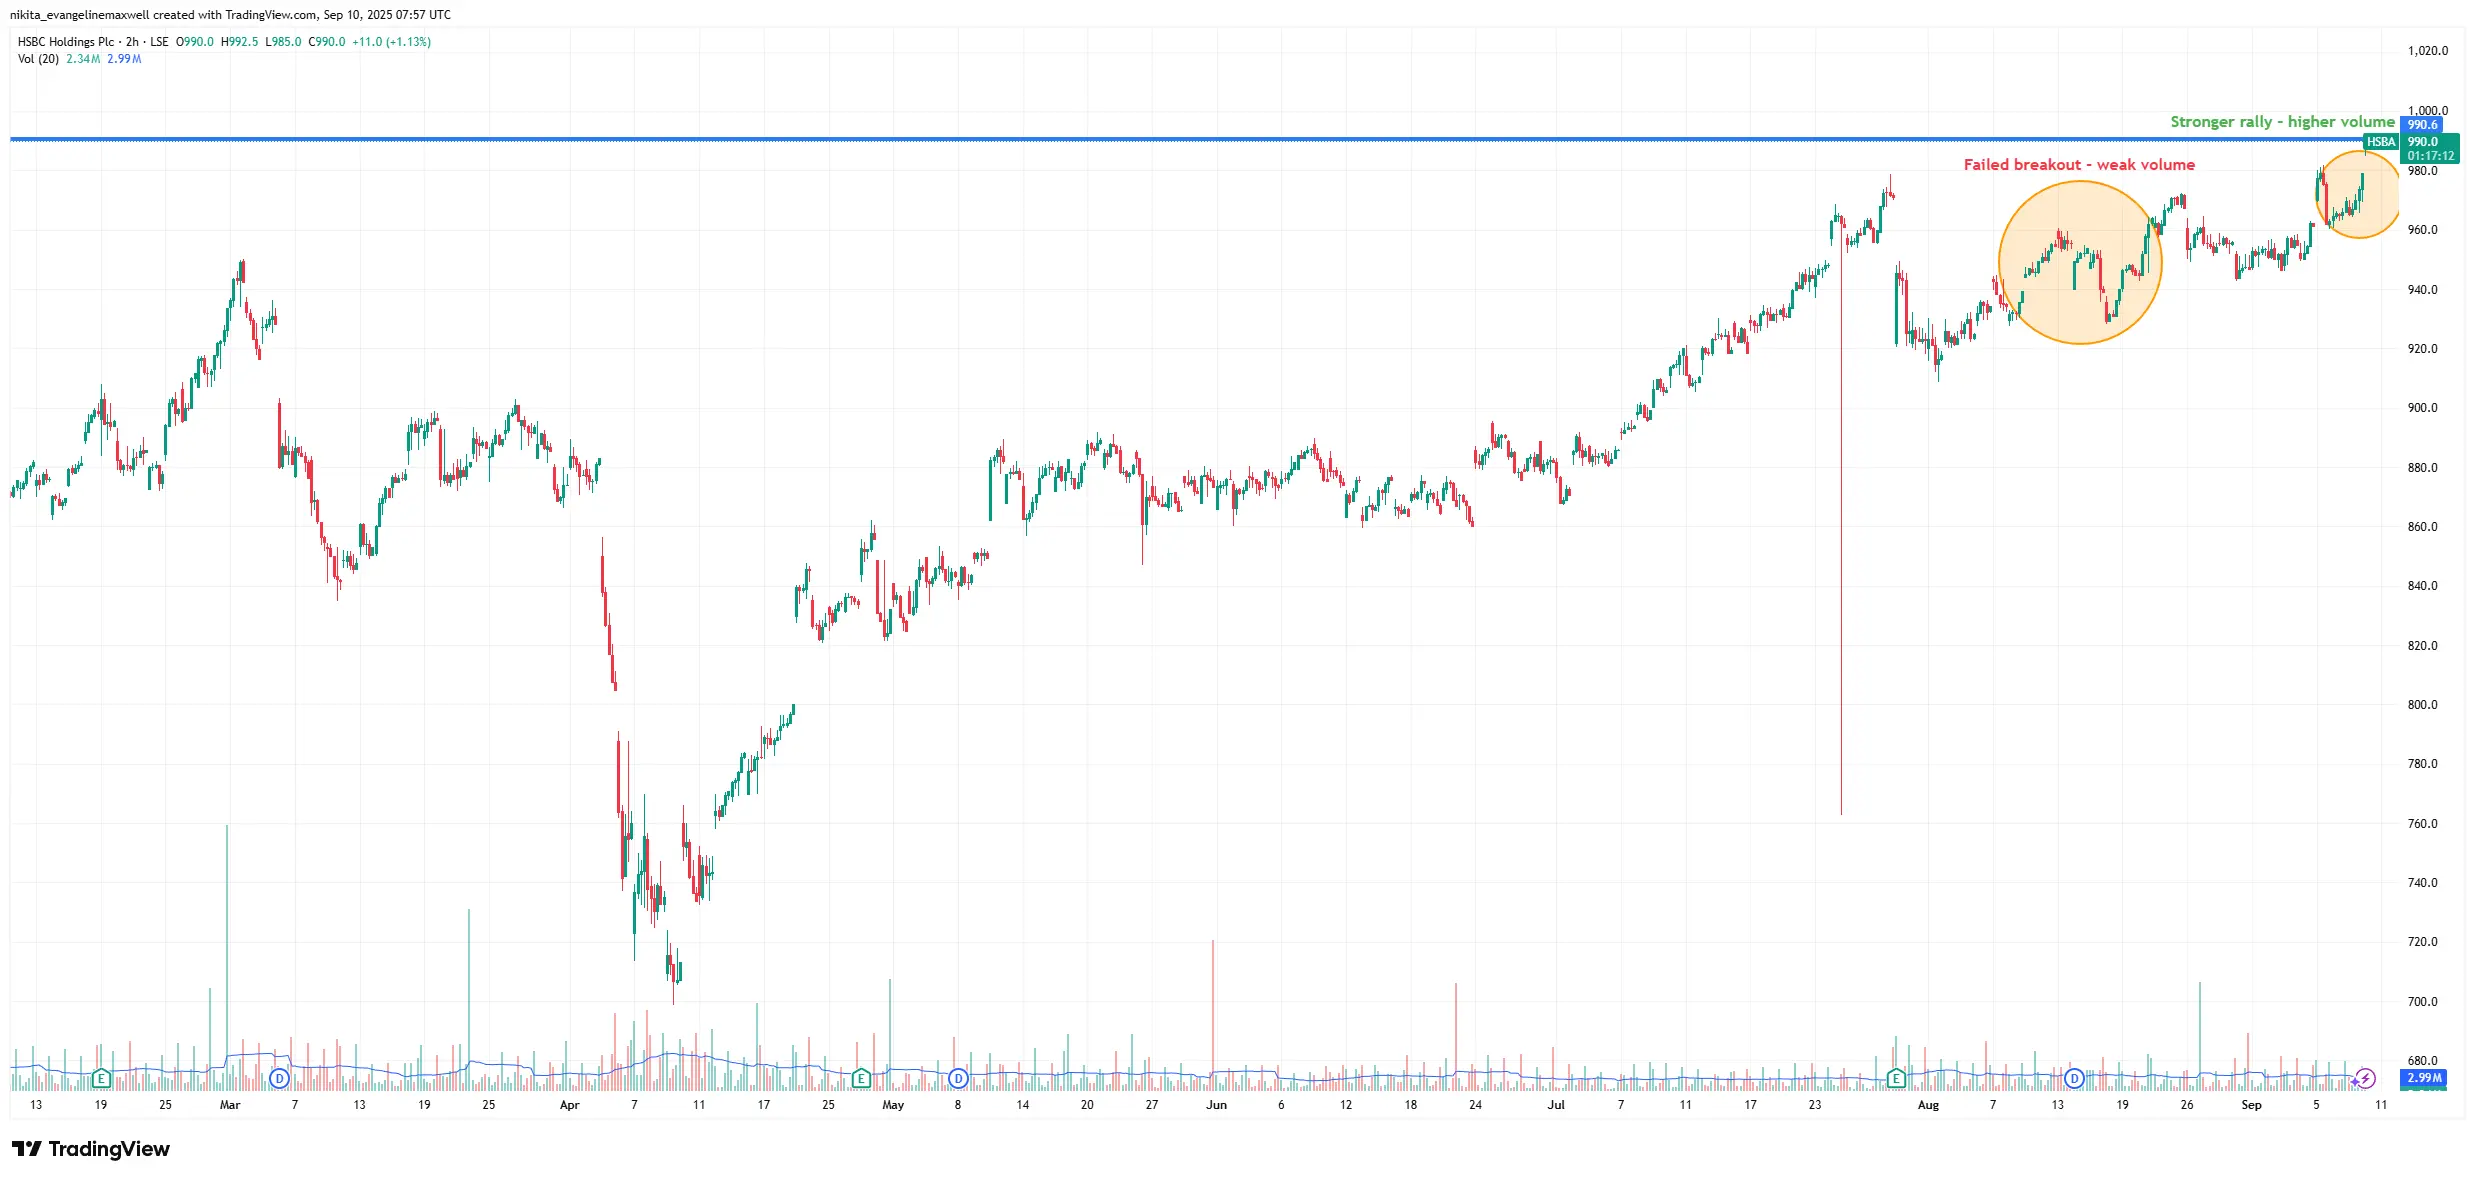
Source: TradingView. All indices are total return in US dollars. Past performance is not a reliable indicator of future performance. Data as of 10 September 2025.
A weak breakout on low volume failed, while a later rally on strong volume held above resistance. Participation confirms conviction.
Trader Tips
- Look at context as a whole: Don’t read a candle in isolation – check trendlines and support.
- Compare to average volume: 30-50% above average is often the threshold that matters.
- Watch for odd spikes: Rebalancing or one-off news can inflate volume without meaning much.
- Pair tools: Indicators like OBV or moving averages can add confidence to what you’re seeing.
Takeaway
Big banks move with fundamentals, but their charts often whisper clues first. Candlesticks show you the pattern, volume tells you if it’s real. Put them together, and you’re far better at spotting true breakouts and avoiding the fake ones. At the end of the day, trading is about tilting the odds – and nothing tilts them like reading price and volume side by side.