Copper vs Gold: What the Metal Pair Says About Growth Expectations
Copper and gold are often viewed as two sides of the same market sentiment coin. While copper tends to reflect expectations for industrial activity, infrastructure spending and economic growth, gold is more commonly associated with safety, wealth preservation and defensive positioning. Comparing the two can therefore provide valuable insight into how investors view the broader economic outlook. In this article, we examine what the copper-to-gold relationship can reveal about growth expectations, risk appetite and the current market environment.
Why This Pair Matters
Copper and gold may both be metals, but they often tell very different stories about the global economy. Copper is closely linked to construction, manufacturing, electrification, data centres and infrastructure spending, making it a useful barometer of economic activity.
Gold, by contrast, is widely viewed as a defensive asset and a store of value.
Because of these differences, traders often compare the two metals to gauge broader market sentiment. When copper is leading, markets are usually showing confidence in growth and industrial demand. When gold takes the lead, investors are often becoming more cautious and looking for safety.
Long-term themes continue to support both metals. Growing demand from electrification, renewable energy projects and artificial intelligence infrastructure continues to support copper, while strong central bank purchases have helped maintain demand for gold.
What Recent Price Action Is Telling Us
Recent price action highlights how leadership between the two metals can shift over time. Both metals experienced strong rallies heading into the early months of 2026 before moving into periods of consolidation.
However, the nature of their recent pullbacks has altered the balance between them.
Macro Metals Snapshot (June 2026)
- Gold Spot: +71.43%
- Copper Futures: +37.88%
- 200-Day SMA Baseline: +26.99%
Key Takeaway:
Gold remains the stronger performer over the broader trend, but copper has shown greater resilience during the recent pullback, supporting a more balanced growth-versus-defence outlook.
Taken together, the chart shows that while gold remains the stronger performer over the broader period, it has experienced a sharper decline from its peak. Copper, meanwhile, has held up relatively better and has stabilised around the +38% level.
Because gold has weakened more than copper in recent weeks, the copper-to-gold ratio has begun to recover. This suggests that investor sentiment has become somewhat more balanced, rather than moving aggressively towards defensive assets.
Copper vs Gold Relative Performance, Copper-to-Gold Ratio and RSI
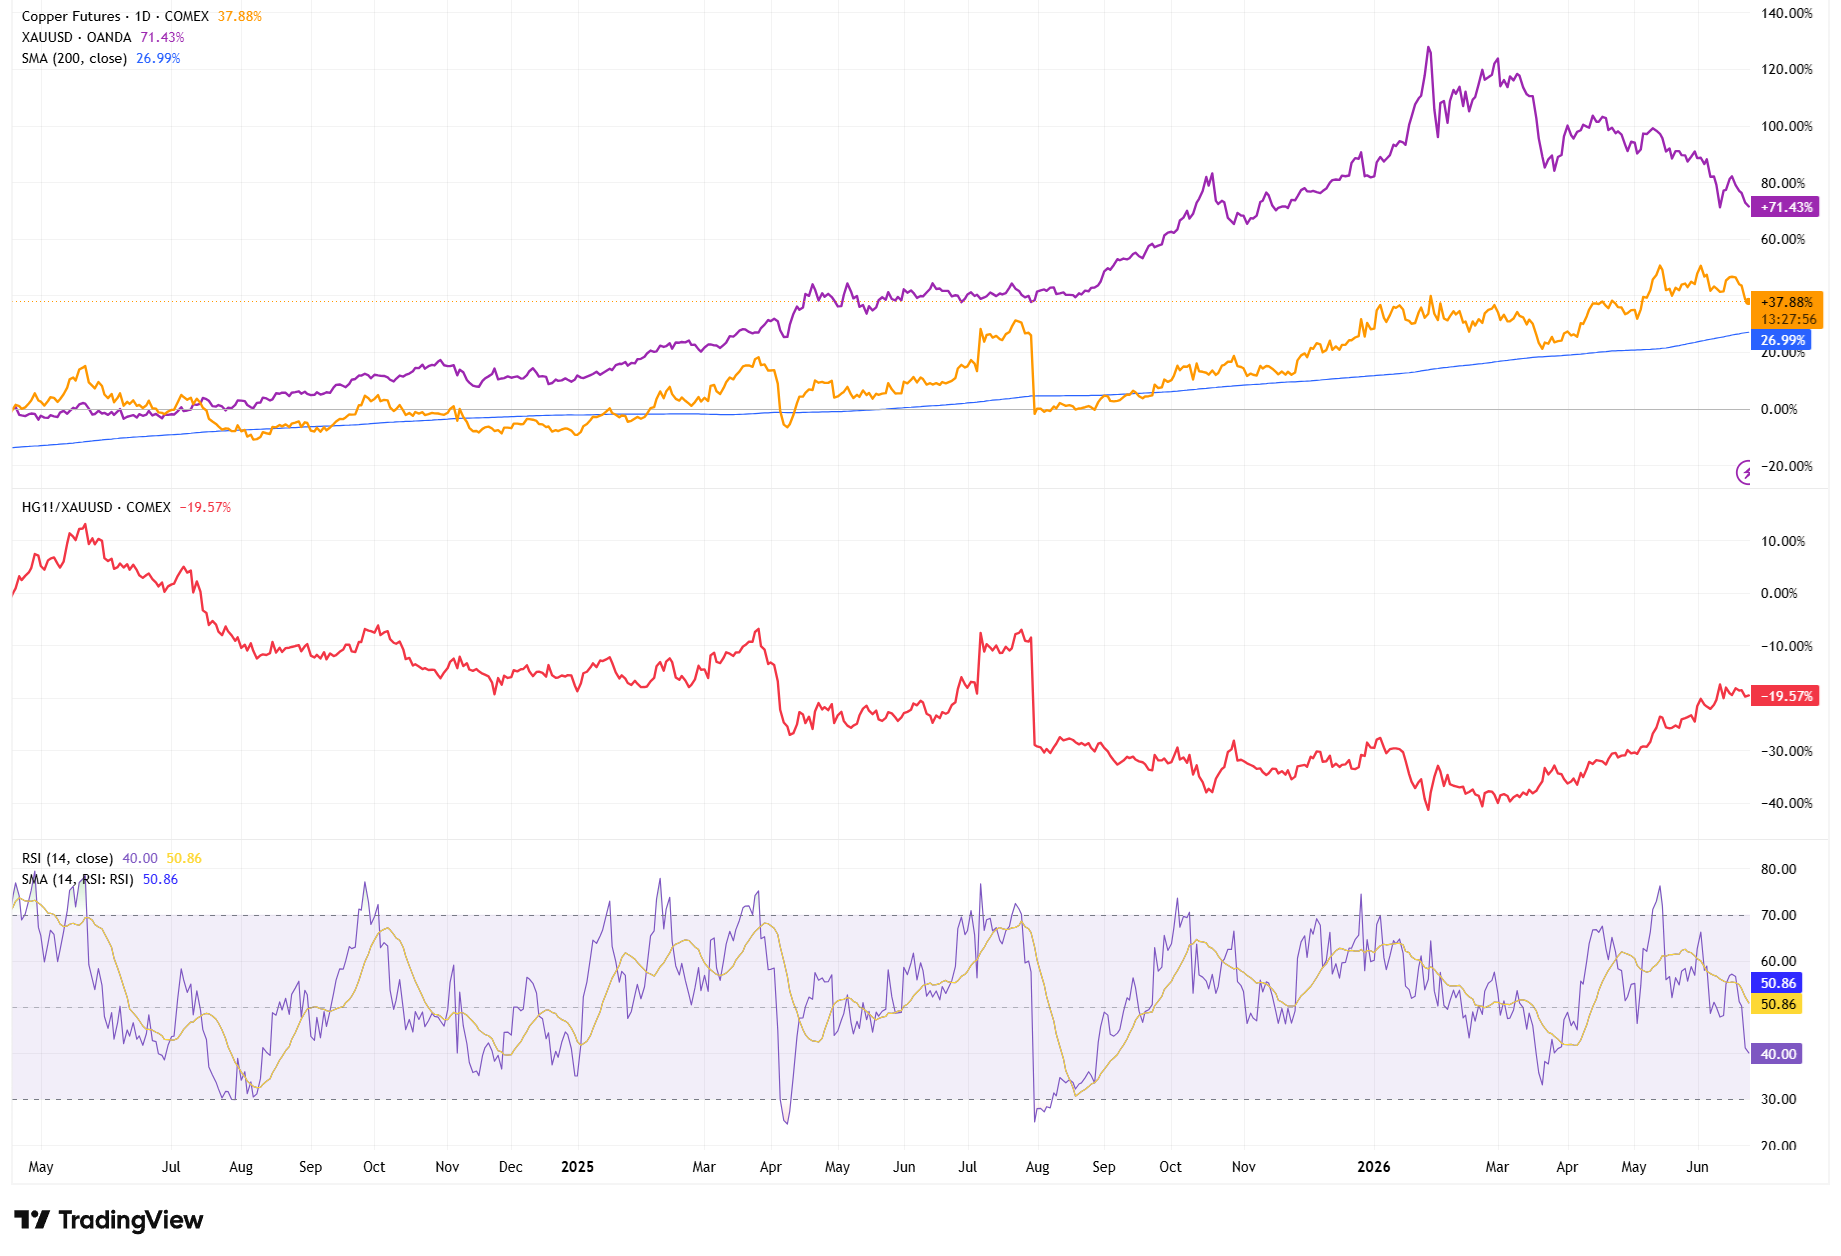
Source: TradingView. Past performance is not a reliable indicator of future performance. Data as of 24 June 2026.
Daily three-panel chart showing percentage performance for Copper Futures (orange line) and Gold Spot (purple line) relative to the 200-day simple moving average (blue line) in the upper panel. The middle panel displays the copper-to-gold ratio, highlighting the recent improvement in copper’s relative performance. The lower panel shows the 14-period Relative Strength Index (RSI) together with its moving average.
Reading the Technical Chart
The upper panel highlights relative performance rather than outright prices. Even when both assets are pulling back, the fact that copper is holding up better than gold points to continued demand for growth-sensitive assets.
Importantly, both lines remain above the 200-day simple moving average, which is currently sitting near +26.99% on the performance scale. This suggests that the longer-term trend remains constructive despite the recent volatility.
The middle panel tracks the copper-to-gold ratio itself. A rising ratio indicates that copper is outperforming gold, while a falling ratio suggests investors are favouring defensive assets.
Traders often combine this ratio with trend direction and support and resistance levels to judge whether leadership between the two metals is strengthening or fading.
Momentum and Market Psychology
Momentum indicators can provide additional context. The Relative Strength Index (RSI) helps traders assess whether momentum behind the ratio is strengthening or cooling.
At present, the RSI is sitting near 40, while its moving average is around 50.86. With the RSI below the midpoint, momentum has cooled and the recent recovery in the ratio has yet to develop into a stronger move. Traders generally prefer to use RSI as a confirmation tool rather than relying on it in isolation.
From a psychological perspective, the relationship between copper and gold reflects the balance between optimism and caution.
Copper tends to benefit when investors are confident about infrastructure spending, manufacturing activity and economic growth. Gold, meanwhile, often becomes more attractive during periods of uncertainty surrounding inflation, monetary policy or geopolitical developments.
Recent price action reflects this balance well. Although gold remains the stronger performer over the broader timeframe, copper’s greater resilience during the recent pullback suggests that investors have not fully shifted towards a defensive mindset.
The Bottom Line
The copper-to-gold relationship provides traders with another lens through which to interpret economic expectations and market sentiment. When copper leads, it often points to stronger confidence and improving growth prospects. When gold leads, it can signal more cautious positioning and increased demand for defensive assets.
The current backdrop suggests a more balanced market environment. While gold continues to outperform over the longer term, copper’s resilience during the recent pullback indicates that investors have not abandoned the growth narrative.
Neither metal moves in isolation. Relative performance, trend structure, support and resistance levels, and momentum indicators all provide useful context. By combining technical analysis with broader macro themes, traders can gain a clearer understanding of what is happening beneath the surface of financial markets rather than relying solely on individual price movements.