


WTI Oil Bounces: Now What?
WTI crude oil has rebounded after a sharp selloff toward the low $80s, raising an important question for traders: is this the start of a broader recovery, or simply a temporary bounce?
Oil markets rarely move in a straight line. Strong rallies are often followed by equally sharp corrections, and recent price action in WTI crude is a clear example of that behaviour. After pushing higher into mid-April, price sold off aggressively before beginning to stabilise and recover.
The focus now is less about whether oil has bounced, and more about whether momentum is starting to shift.
What the Chart Shows
WTI initially trended higher into the mid-$90s before that move began to lose momentum. What followed was a sharp selloff, with price falling quickly toward the lower $80s.
Moves like this are rarely gradual. They often reflect a shift in sentiment or positioning rather than a slow change in trend. The speed of the decline suggests earlier bullish momentum had become stretched, triggering profit-taking and a rapid repricing lower.
The more important development came next.
Rather than continuing lower, price began to stabilise in the $84 to $85 region. Instead of accelerating to the downside, the market started to form a base. That shift matters because it suggests selling pressure may have eased, with buyers stepping back in at lower levels.
WTI Crude Oil: Recovery from Recent Lows
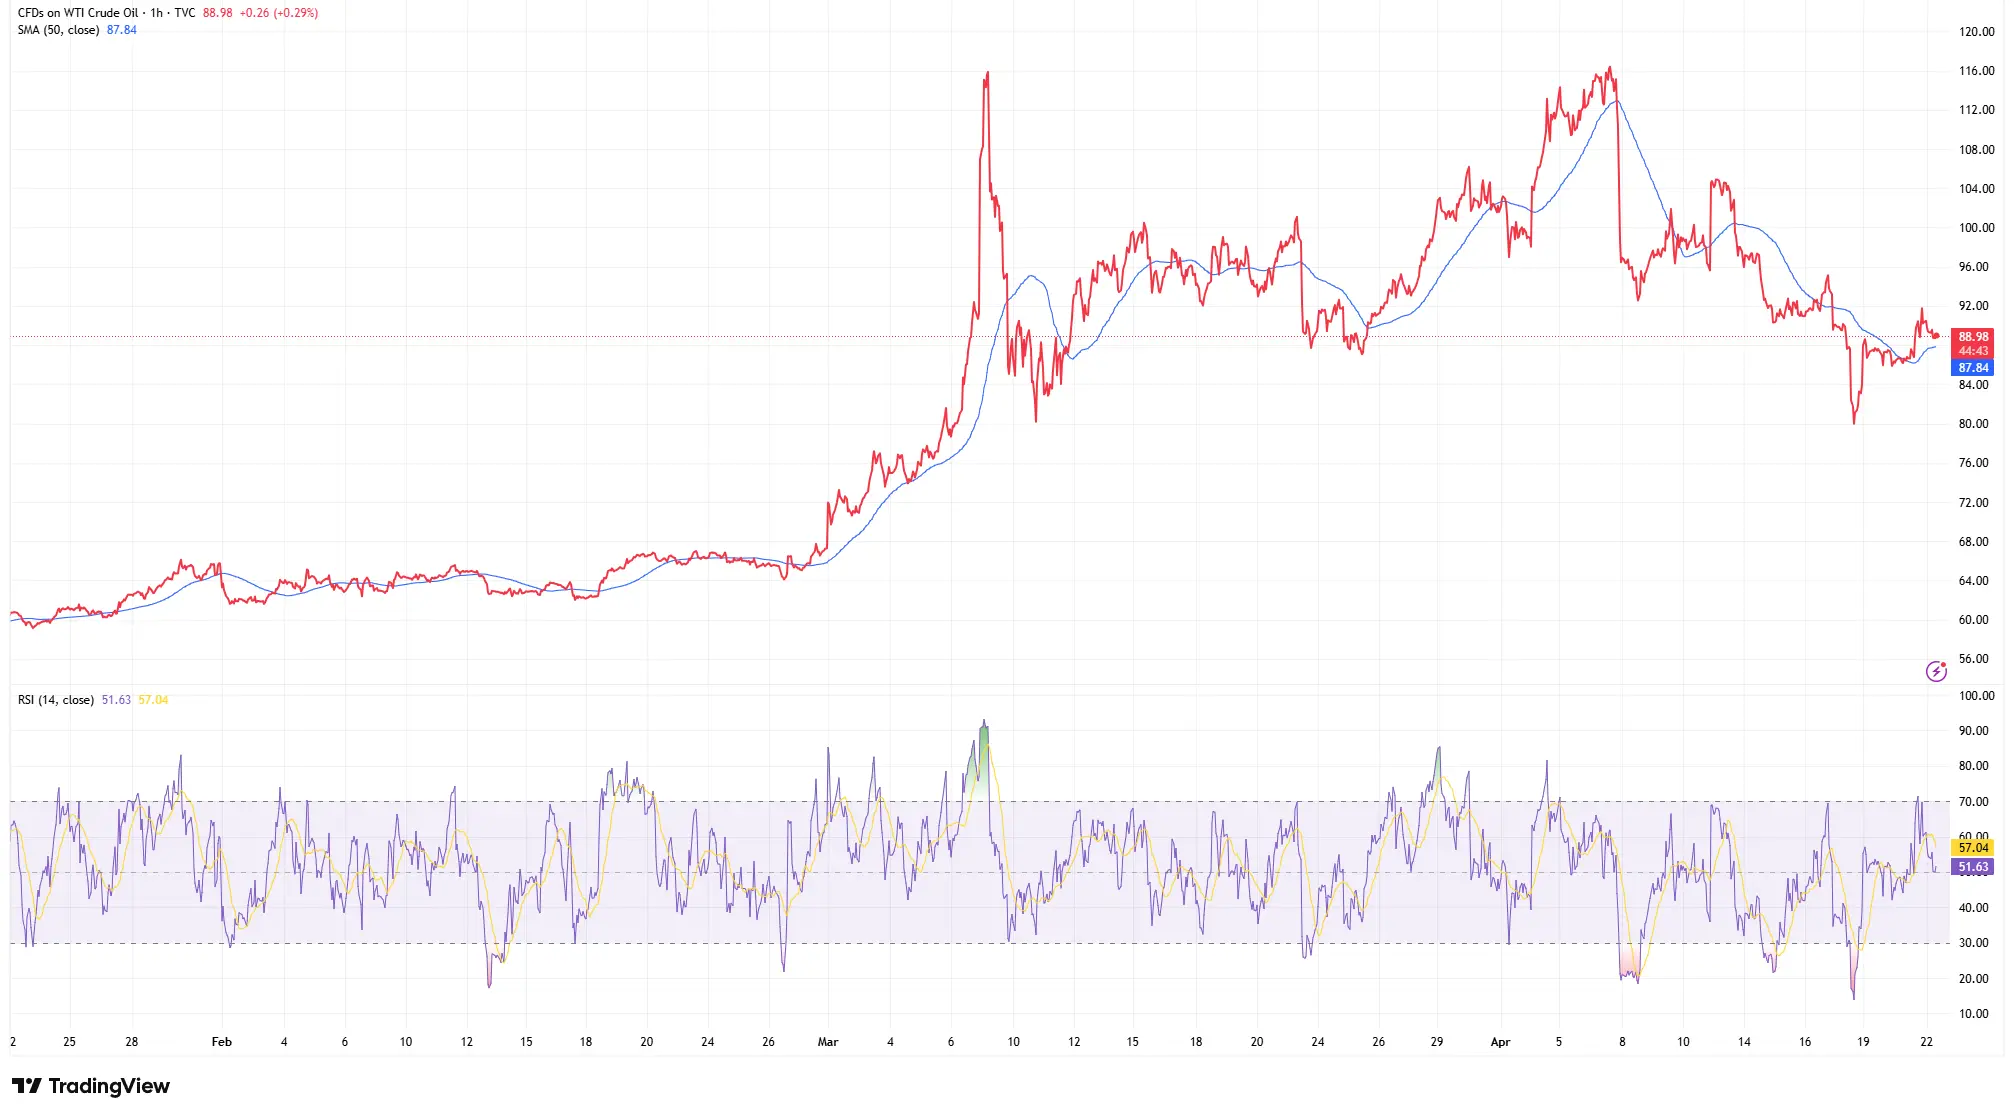
WTI crude oil stabilises near the low $80s before rebounding toward the upper $80s, with price moving back above the short-term moving average as momentum begins to improve.
The Recovery Structure
From that stabilisation phase, WTI began to recover, moving back toward the upper $80s. Importantly, this rebound has not come through one sharp spike. Instead, it has developed in a more controlled and gradual way.
Price action shows a series of modest pullbacks followed by renewed upside attempts, with each dip holding above the previous low. At the same time, rallies have started to extend slightly further on each move higher.
This creates an early higher-low structure, which is often one of the first signs that sentiment is improving.
That kind of behaviour can suggest buyers are returning in a more measured way. Rather than chasing price aggressively, they are stepping in during consolidation phases, which is typically healthier than a recovery driven purely by short-term volatility.
RSI and Momentum
Momentum indicators help reinforce that shift.
The Relative Strength Index (RSI) measures the speed and strength of price movements on a scale from 0 to 100.
During the selloff, RSI moved lower, reflecting strong downside momentum. As price stabilised and recovered, RSI also turned higher and moved back toward the mid-range.
At present, RSI is not in overbought territory. It remains closer to neutral levels, suggesting momentum is improving without yet appearing stretched.
In practical terms, that means the rebound is not currently showing clear signs of exhaustion. If price structure continues to hold, there may still be room for the recovery to develop further.
Key Levels to Watch
Another notable shift is that price has moved back above its short-term moving average. Moving averages are often used to gauge short-term trend direction, and reclaiming them can be an early sign that conditions are improving. However, this alone does not confirm a full reversal.
What matters more is how price behaves next.
The recent rebound has brought WTI back toward the $88 to $90 area, which now acts as a key resistance zone. This region has previously capped upside attempts, making it an important level to watch.
If price can hold above the mid-$80s while continuing to form higher lows, the recovery structure remains intact.
A sustained break above $90 would strengthen the case for broader upside continuation.
On the other hand, if price fails to break higher and moves back below recent support, it would suggest the rebound is losing momentum rather than building on it.
The Bottom Line
The recent rebound in WTI crude reflects improving sentiment after a sharp decline, but it does not yet confirm a full trend reversal.
What the chart currently shows is a transition phase, where selling pressure has eased and buyers have started to regain control, but only gradually.
For now, the focus remains on structure rather than prediction.
If price can maintain higher lows and build on the current recovery, momentum may continue shifting in favour of the upside. If not, the latest move may prove to be a temporary bounce within a broader range.
As always, the key is not to assume where price will go next, but to watch how it behaves around the levels that matter.
WTI Oil FAQs
Why is WTI oil rising?
WTI crude has rebounded after a sharp selloff, with improving momentum and buyers stepping in near recent support levels.
What is the key resistance level for WTI oil?
The $88 to $90 region is currently a major resistance zone traders are watching.
Is the WTI rebound bullish?
The rebound shows improving structure, but a sustained break above resistance would strengthen the bullish case.
What does RSI show for oil?
RSI has recovered toward neutral territory, suggesting momentum is improving without yet appearing overextended.