Volume Check: Will EUR/USD Break Out or Fake Out?
EUR/USD Near 2025 Highs – But With Low Volume
Source: TradingView. All indices are total return in US dollars. Past performance is not a reliable indicator of future performance. Data as of11 June 2025.
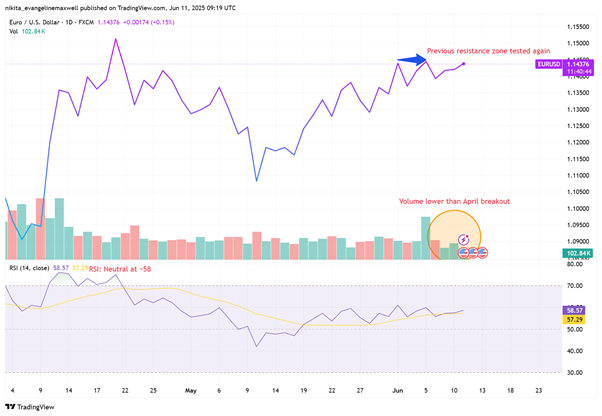
EUR/USD is trading near its highest level of 2025, and on the surface, the trend looks strong. But traders aren’t just watching the price – they’re asking a deeper question: Is this move backed by real demand, or could it be a short-lived spike?
The answer often lies in one classic technical indicator: volume.
In an age where algorithms react to every economic headline and central bank whisper, volume remains one of the most trusted tools for confirming conviction. It doesn't predict direction, but it shows whether real money is stepping in – or whether the move lacks staying power.
Why Volume Still Matters
Volume represents the number of contracts or lots traded during a specific timeframe. The indicator reveals whether market participants are actually driving price movements during breakouts or breakdowns or if the move will likely turn around.
EUR/USD retests 1.1450 with limited volume – a real breakout or another fakeout?
Source: TradingView. All indices are total return in US dollars. Past performance is not a reliable indicator of future performance. Data as of11 June 2025.
When trading activity (or volume) increases during a price breakout, it usually signals strong interest and momentum behind the move. But if a breakout happens with little volume, it may not last – and those who buy in too early could get caught in a quick reversal. That’s why traders look at volume bars on the chart: they show whether the move is being backed by real participation or not.
The EUR/USD Setup: What the Chart Says Now
After rallying from below 1.08 in January to nearly 1.1450 by early June, EUR/USD appears to be at a decision point. The pair is currently trading around 1.1421, just under a resistance zone that’s been tested several times since April.
But despite the higher prices, the enthusiasm hasn’t been overwhelming. Volume on June 11 was just 87.7K, slightly below average for a bullish continuation. Meanwhile, RSI sits at 57.55 – a neutral zone that suggests there's room to move in either direction, but no strong momentum for now.
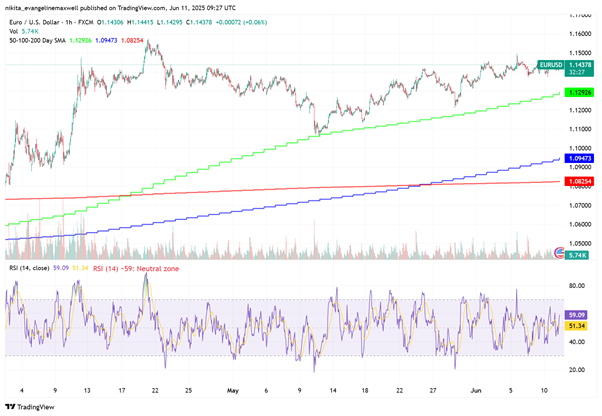
EUR/USD 50/100/200-Day Moving Averages and RSI – June 2025 Snapshot
Source: TradingView. All indices are total return in US dollars. Past performance is not a reliable indicator of future performance. Data as of11 June 2025.
What traders will notice is the alignment of trendlines. The 50-day SMA has risen to 1.1292, acting as dynamic support. The 100-day and 200-day averages (at 1.0947 and 1.0825 respectively) are now positioned well below the price, confirming a longer-term uptrend. But until volume confirms, the chart remains vulnerable to a reversal.
Real Breakout or Fakeout?
We’ve seen this play out before. In late April, EUR/USD spiked toward 1.1458 – only to retreat back to the 1.1180 range by mid-May. That earlier move lacked volume and conviction, resulting in a quick rejection. Now that price is approaching those same levels again, traders are watching to see whether history will repeat.
What would confirm a real breakout? A daily close above 1.1450 with strong volume. What would signal a fakeout? Another push higher followed by a reversal – especially if volume remains soft and RSI begins to diverge.
What’s Driving the Hesitation?
Fundamentals are part of the hesitation. The ECB held rates steady at its last meeting but hinted that cuts could come later in the year. Meanwhile, the Federal Reserve remains split on its next move, with US CPI data due tomorrow adding another layer of uncertainty.
With both central banks taking a wait-and-see stance, the market is left in limbo – and that’s exactly why technicals like volume, trendlines, and RSI are becoming more important for short-term signals.
Bottom Line
EUR/USD’s rally has been steady, but a lack of volume at current levels raises questions. For now, the pair is holding above key moving averages and RSI is healthy – but it’s sitting right below a ceiling that has rejected price before.
The next move may be driven by data, but volume will tell you if traders believe it.
Until then, the smartest move isn’t to guess the breakout – it’s to wait for the volume to confirm it.
Follow EC Markets for more live FX insight and technical setups.