Why is the Broader Market Being Outpaced by Tech?
In recent weeks, both the Nasdaq 100 and the S&P 500 have moved higher, but they have not risen at the same pace. The Nasdaq 100, with its heavier exposure to technology and growth stocks, has been climbing faster, while the broader S&P 500 has lagged slightly. This split performance can offer useful insight into market leadership and overall sentiment.
When the Nasdaq outperforms, it often reflects a more risk-on environment, where investors are willing to favour higher-growth, higher-volatility stocks. When the gap narrows, or the S&P 500 begins to keep pace, it can suggest a more balanced or cautious tone. Looking at relative performance in this way helps reveal where capital is flowing within the market.
What the Chart Actually Shows
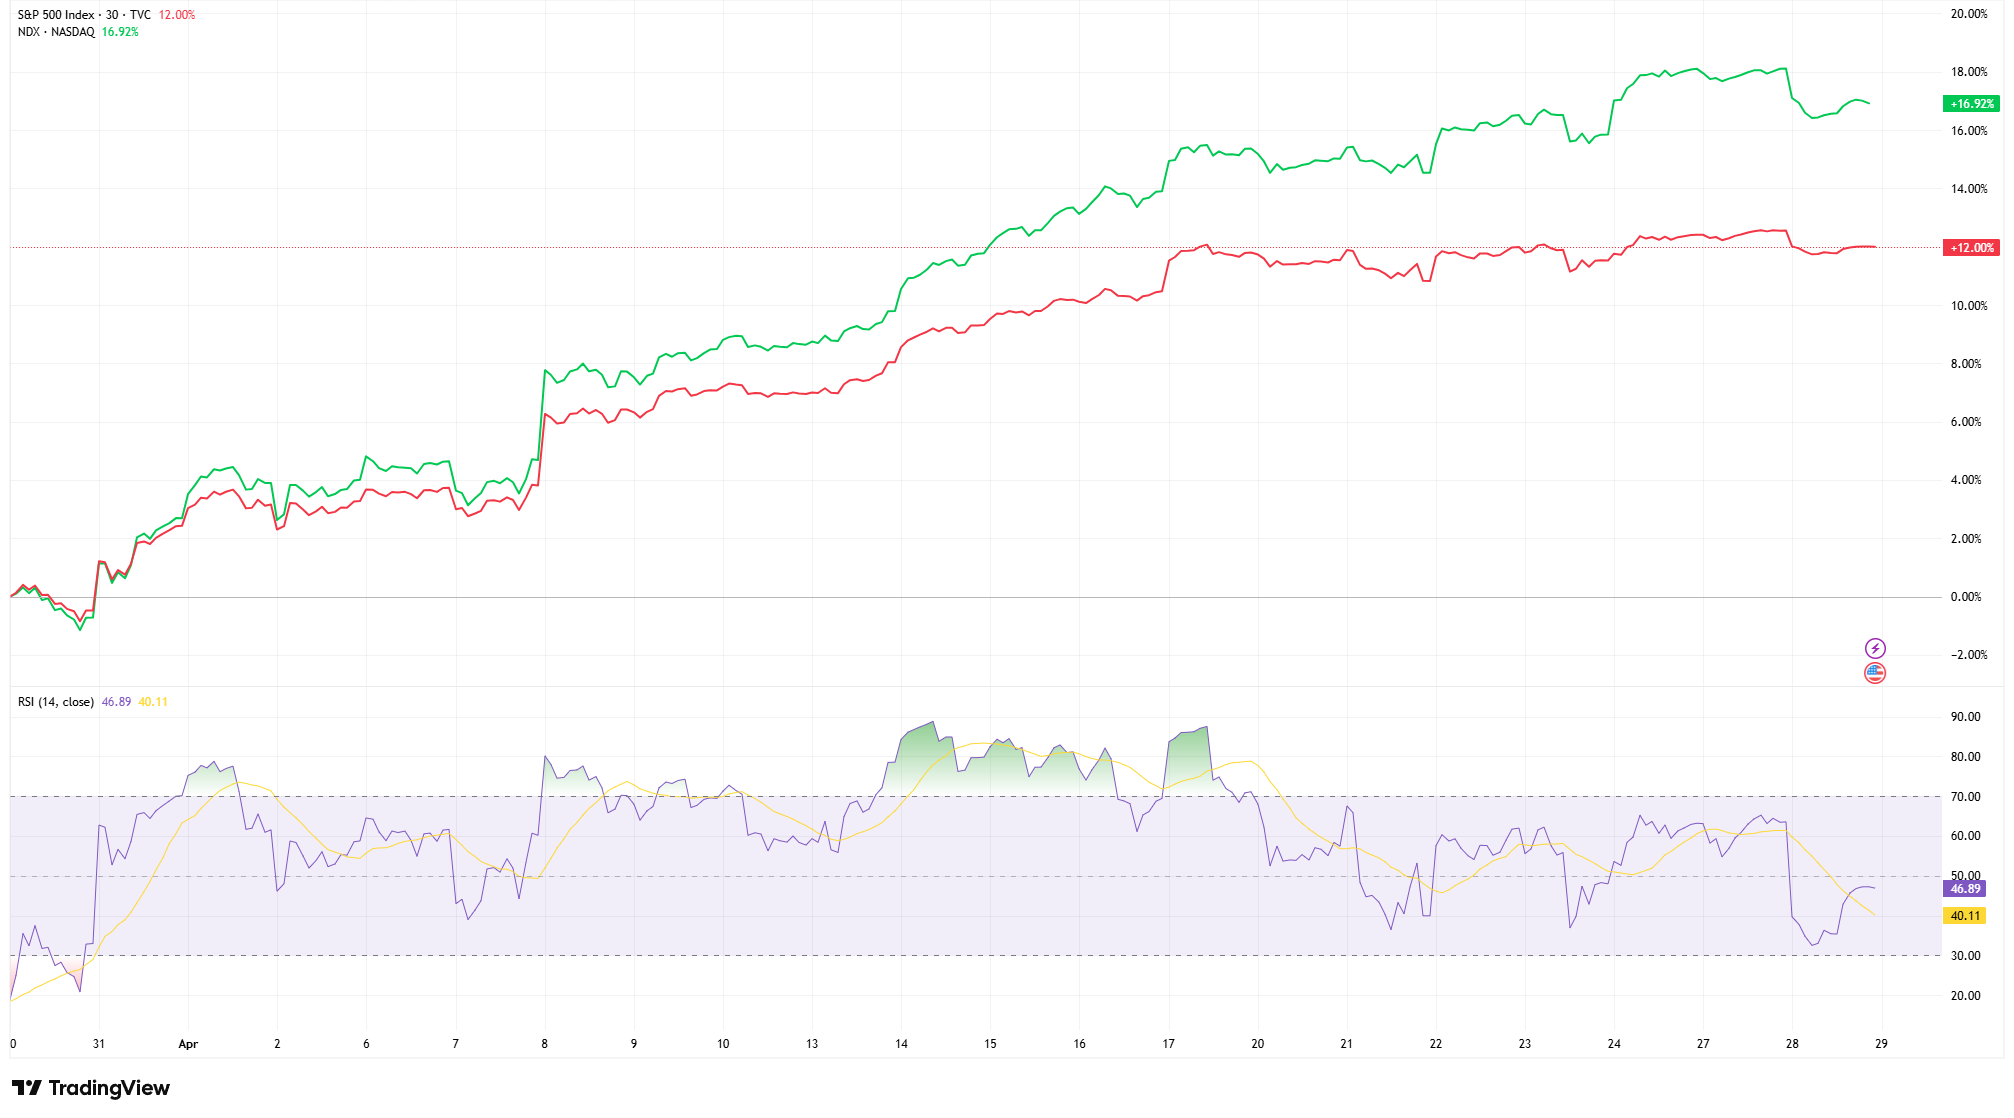
The chart below tracks the percentage performance of both indices over the past month. Both started the period on relatively similar footing before trending higher, but the Nasdaq clearly pulled ahead as the move developed.
By mid-month, the Nasdaq had gained close to +17%, compared to around +10% for the S&P 500. This widening gap, roughly 6-7%, highlights a period where technology stocks were leading the market. The move was not abrupt but developed steadily, suggesting consistent demand rather than a short-term spike.
More recently, however, that gap has begun to stabilise. While the Nasdaq remains ahead, the pace of outperformance has slowed. The latest readings show the Nasdaq up around +16.9% compared to +12.0% for the S&P 500. In practical terms, the leadership remains intact, but momentum behind that leadership is no longer accelerating.
This shift is subtle but important. It suggests that while investors continue to favour growth stocks, the intensity of that preference may be easing slightly.
Nasdaq vs S&P 500 Relative Performance (past month)
How to Read this Outperformance
Looking at the comparison between the Nasdaq and S&P works in a similar way to a relative strength view. When one index consistently outperforms another, it typically reflects stronger investor confidence in that segment of the market.
In this case, sustained Nasdaq outperformance suggests a continued preference for growth-oriented sectors. This type of leadership often appears during stronger market phases, when investors are more comfortable taking on risk in search of higher returns.
At the same time, the recent stabilisation in the gap between the two indices adds an additional layer of context. It does not signal a reversal, but it does suggest that the market may be transitioning from a strong, momentum-driven phase into something more balanced.
What Momentum is Telling Us
Momentum indicators, specifically the Relative Strength Index (RSI), provide essential context to this trend. During the earlier acceleration phase, RSI pushed into overbought territory (above 70), aligning with the widening performance gap.
More recently, however, the RSI has cooled significantly. The latest reading of 46.89 places momentum squarely in the mid-range. Importantly, this moderation does not imply a bearish reversal; rather, it suggests that the earlier surge in relative strength is transitioning into a consolidation phase. For traders, an RSI holding near the 50.00 level represents a neutral “pause” where the market catches its breath before the next directional move.
What Traders May Be Watching Next
Beyond momentum, the price structure remains the primary guide. The relative performance has been characterized by a steady progression of higher highs, though a sharp, short-term dip at the end of April (visible on the green Nasdaq line) suggests a minor test of tech resilience.
Traders may watch whether the gap between the two indices begins to narrow further on the Nasdaq. If the Nasdaq fails to bounce from this minor pullback while the S&P 500 remains flat or rises, the “outperformance gap” will narrow decisively. A deeper move lower in RSI would suggest that momentum is fading more meaningfully.
The Bottom Line
The current picture reflects continued leadership from technology stocks, but with momentum beginning to stabilise. The Nasdaq 100 remains ahead of the S&P 500, signalling that risk appetite is still present, but the pace of outperformance is no longer increasing.
In practice, the focus tends to remain on structure rather than prediction. If the Nasdaq continues to lead, it reinforces the idea of a supportive, growth-driven environment. If that leadership begins to fade, it may suggest a more balanced or cautious phase is developing.
Relative performance does not determine market direction on its own, but it provides valuable insight into how different parts of the market are behaving. For now, the signal is clear: technology continues to lead, but the market may be entering a phase where that leadership is being tested rather than extended.