Dollar Direction in Focus: What FX Charts Are Signalling Now
The US dollar has entered a stretch of hesitation. Rate expectations are shifting, US data has softened, and global sentiment feels increasingly reactive rather than directional. After a strong surge and a sharp unwind over the past year, the greenback’s chart isn’t giving traders much to latch onto. There’s no clear partiality, and no strong signal from the Fed either. In these conditions, it’s the technicals that start to matter more. The fundamentals are noisy; the charts are quieter, but not silent.
Take the broader dollar index. It’s moved from trending to drifting. Earlier in 2025, we had momentum, whether it was higher or lower. Now the range has tightened, and those familiar trend channels have started to flatten out. Price is just bouncing between levels, respecting resistance and holding support, but not following through. The market looks coiled. One strategist recently called it a “decision zone,” and that’s exactly how it feels: no breakout, no breakdown, just tension building.
DXY: Dollar Coils After Momentum Fades
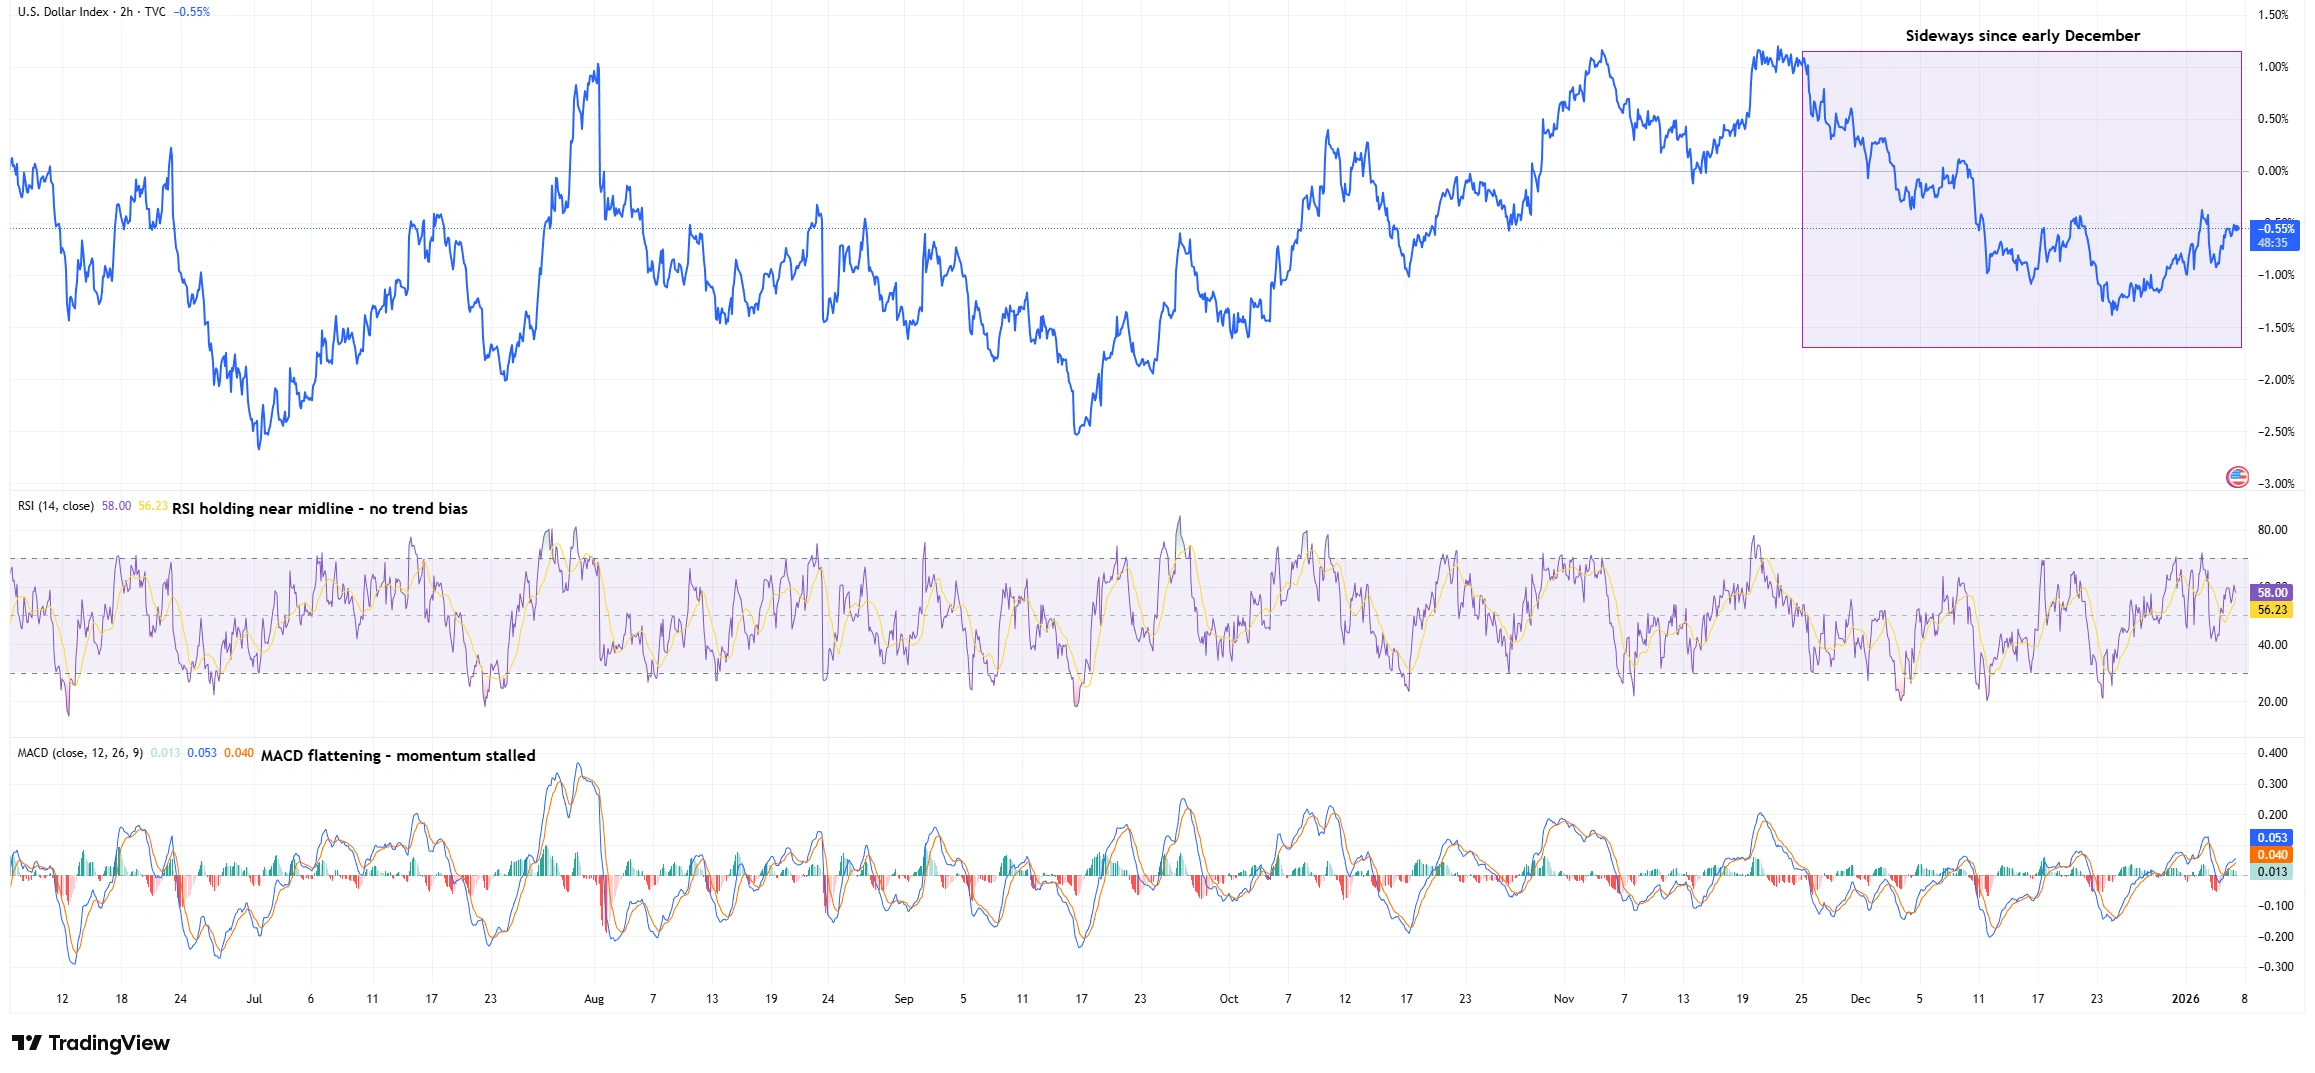
Source: TradingView. All indices are total return in US dollars. Past performance is not a reliable indicator of future performance. Data as of 07 January 2025.
The Dollar Index has settled into a sideways drift since early December. RSI and MACD show momentum flattening, suggesting the market is coiling, not trending.
You can see the same thing across major USD pairs. EUR/USD has attempted to pop higher more than once, only to get dragged back into range. USD/JPY has tested the top end but struggled to stay bid. GBP/USD is moving, then stalling. Even GBP/JPY, a cross that’s had decent energy, is showing signs of short-term fatigue. The patterns repeat: attempted breakouts that fade, repeated touches of the same zones with no resolution. When markets behave like this, it’s not a lack of interest. It’s a lack of commitment. The market is probing, but it’s not convinced.
EUR/USD: Breakout That Faded
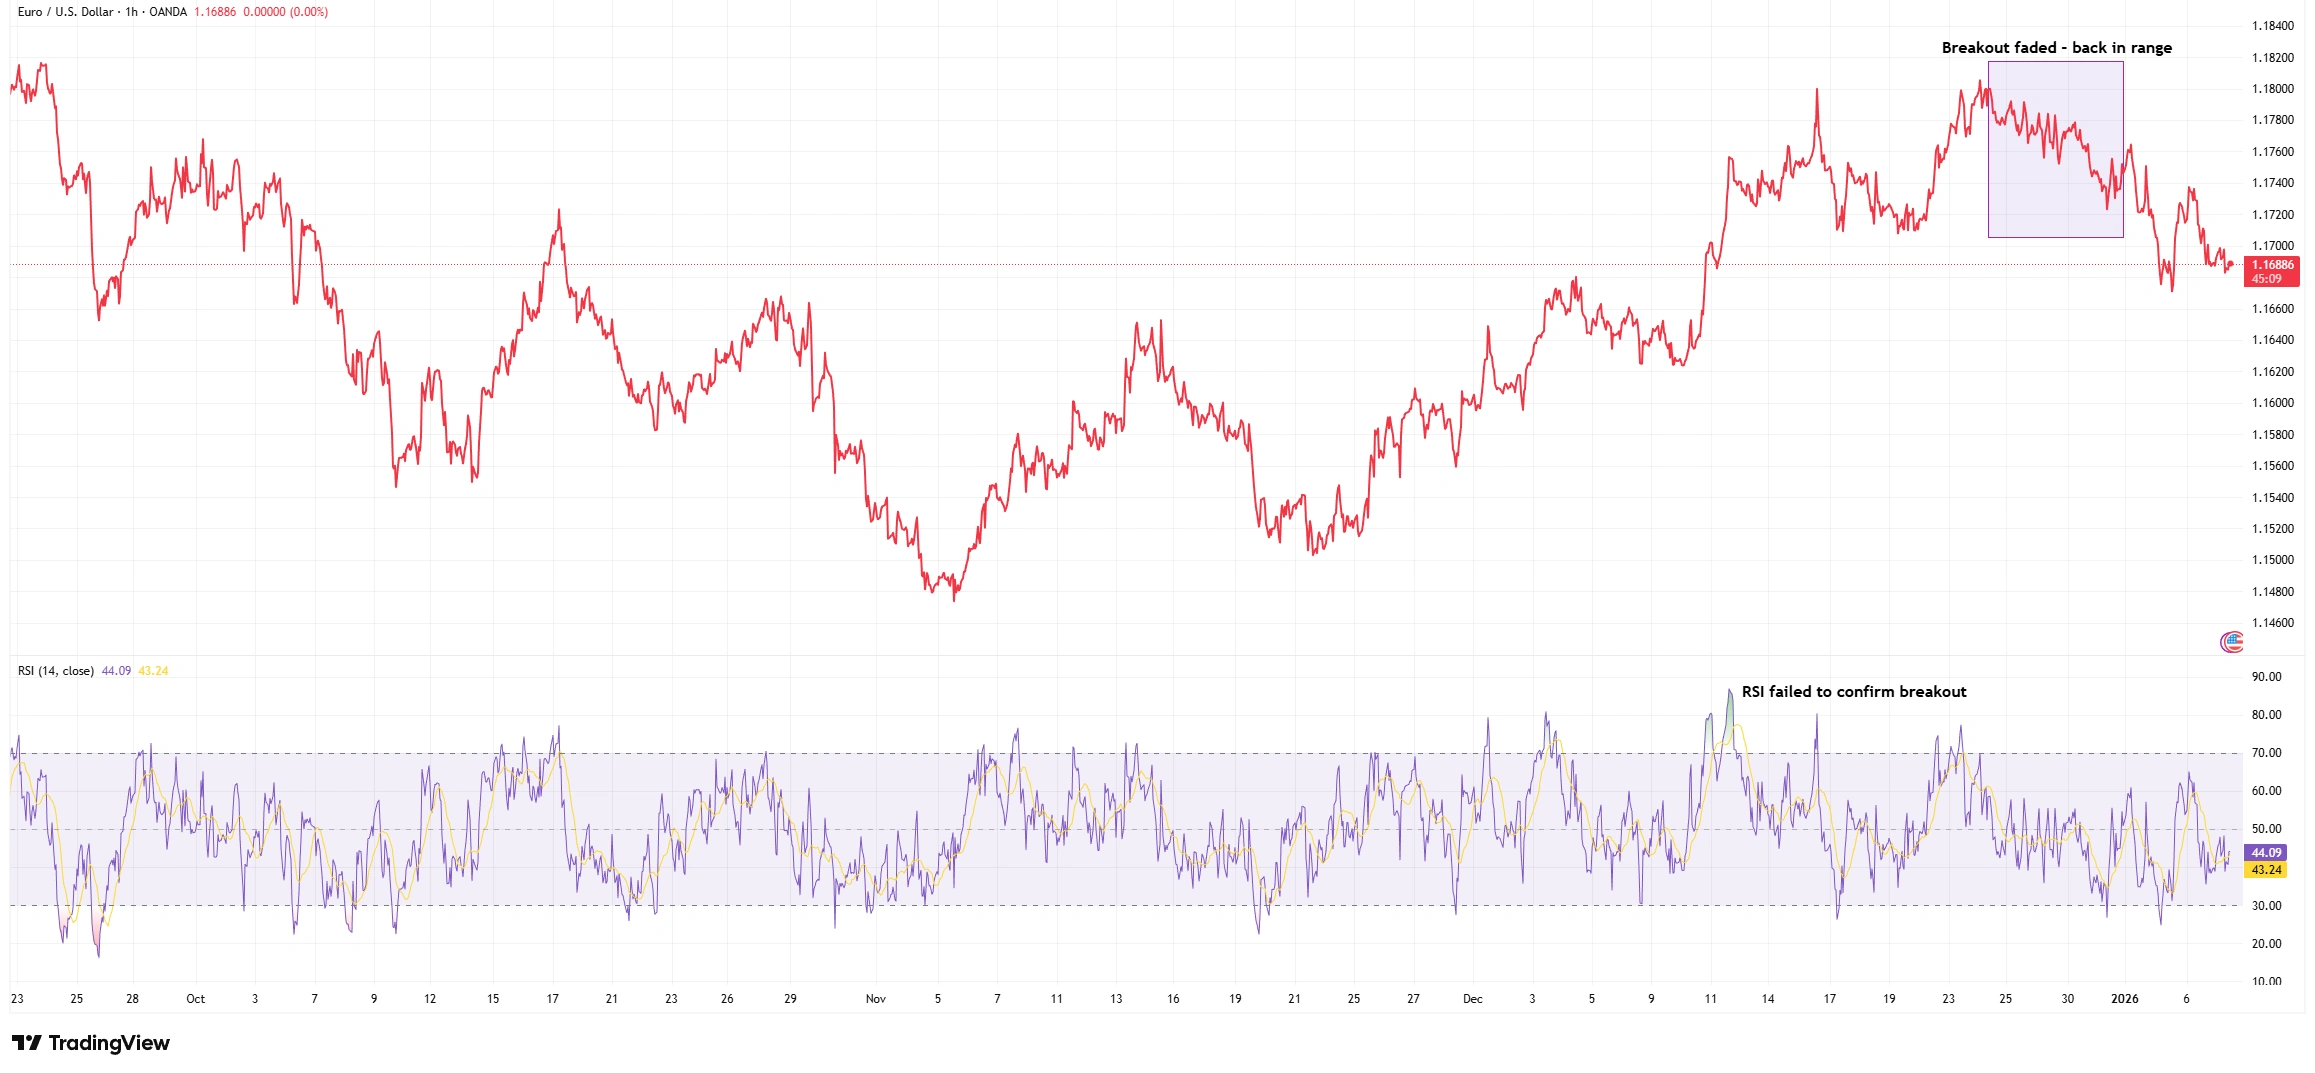
Source: TradingView. All indices are total return in US dollars. Past performance is not a reliable indicator of future performance. Data as of 07 January 2025.
EUR/USD briefly broke above key resistance in December but failed to hold. RSI momentum lagged the move, reinforcing the lack of commitment, and price slid back into range.
A big part of this is rate expectations. The Fed appears done with hikes, and the conversation has shifted to cuts. That’s not a surprise anymore, as it’s mostly priced in. And when the market stops reacting to data and starts waiting for confirmation, charts often settle into choppy, range-bound patterns. The reaction to news is shorter. Moves fizzle out. It’s not that traders don’t care; it’s that they’ve already moved ahead in their expectations. Price is now digesting that forward view, not chasing it.
Momentum indicators are backing this up. RSI on most USD pairs is sitting in neutral territory, neither stretched nor reversing. MACD histograms are barely flickering. That tells you momentum has faded. In some cases, like USD/JPY, price is retesting highs but RSI is printing lower peaks, a classic momentum divergence. This doesn’t mean a sharp reversal is coming, but it does suggest energy is waning. It’s the kind of technical fatigue that often leads to sideways movement or slow, grinding consolidation.
USDJPY – Lower High Structure with RSI Divergence
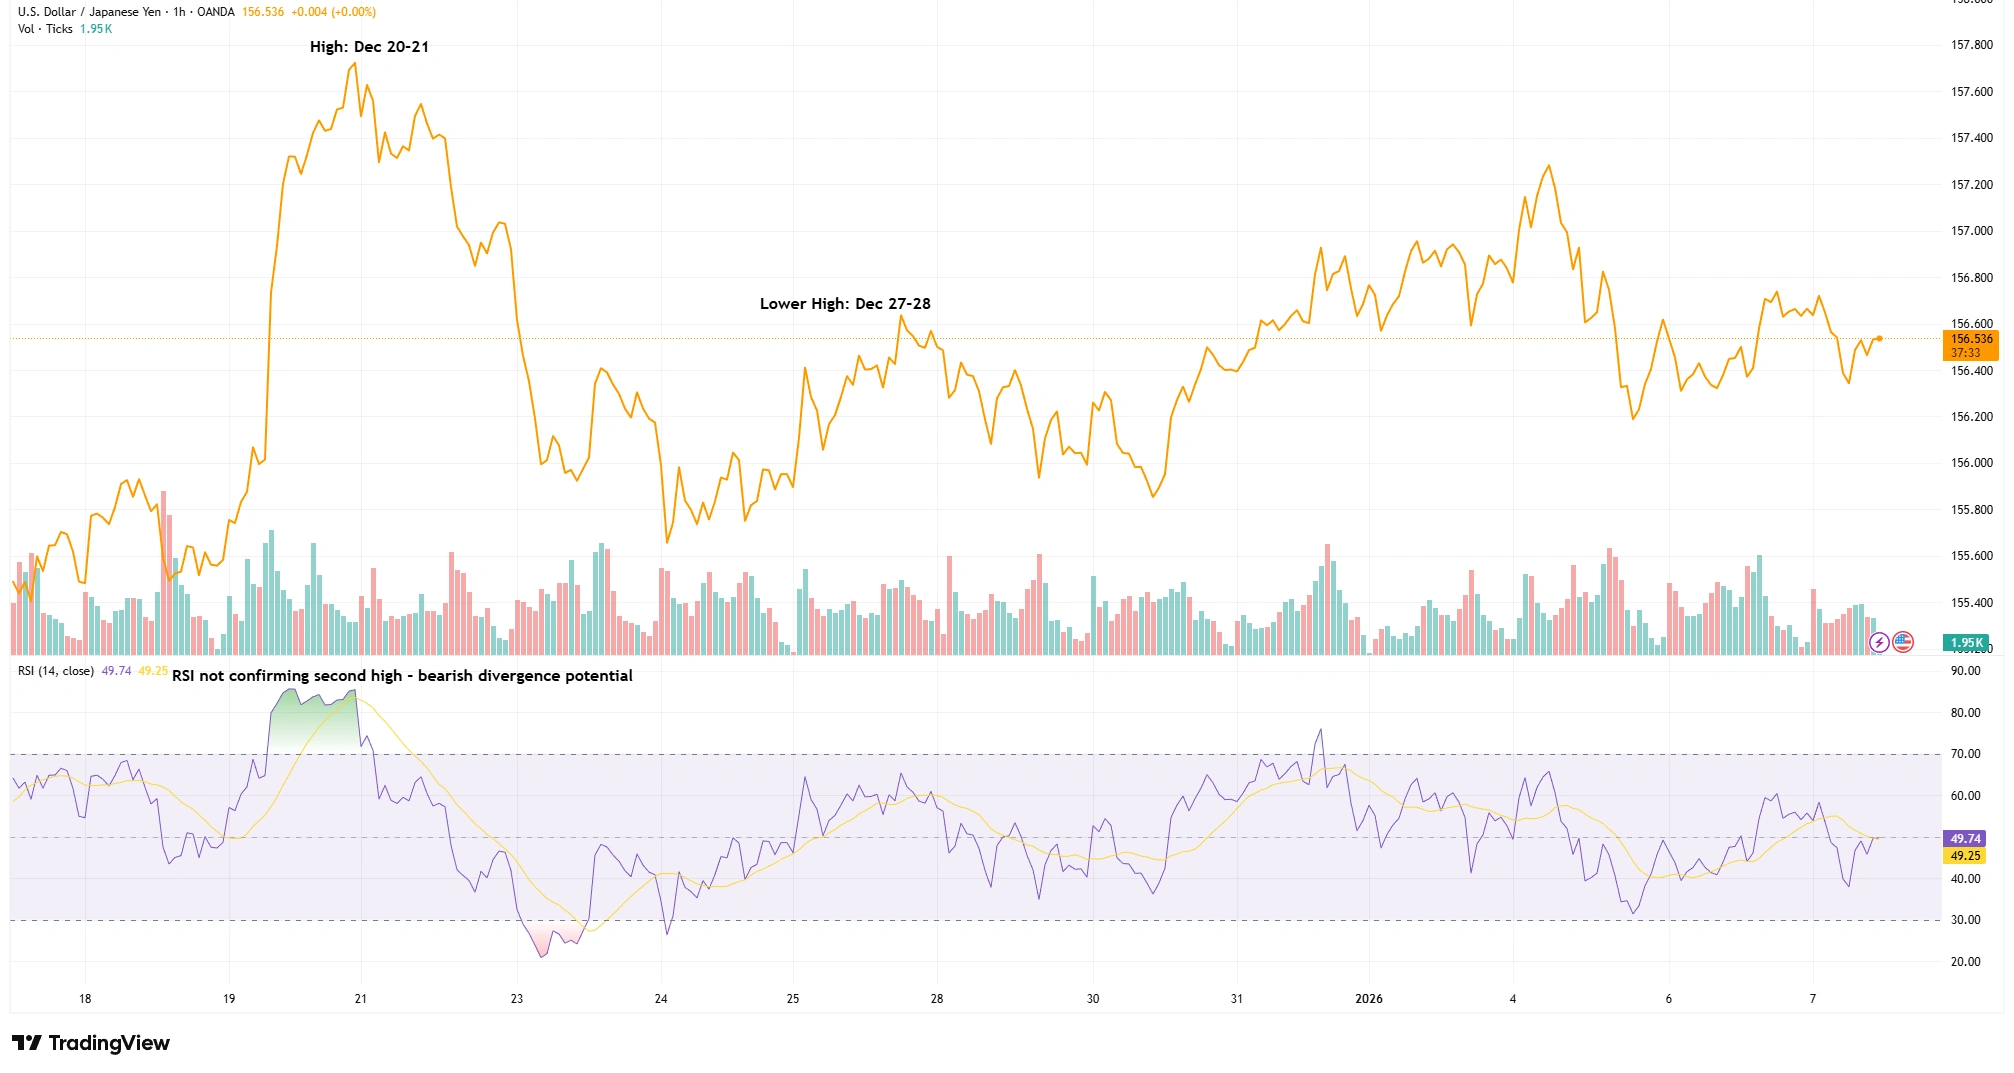
Source: TradingView. All indices are total return in US dollars. Past performance is not a reliable indicator of future performance. Data as of 07 January 2025.
USDJPY printed a peak around Dec 20-21 and a lower high near Dec 27-28. RSI failed to confirm the second high, suggesting bearish divergence and a possible shift in trend momentum.
It’s also worth pointing out that “the dollar” isn’t moving the same way everywhere. EUR/USD and GBP/USD have shown broad dollar softness, while USD/JPY stayed bid for most of the year. That divergence reflects what’s happening on the other side of the trade, such as eurozone data, BoE signals, and Japan’s yield curve. It reminds us that the dollar isn’t a one-direction story. Each chart has its own structure, its own rhythm. That’s why context is everything. A clean setup in one pair might be absent in another. You’ve got to look pair by pair.
Right now, the dollar’s not trending. But that doesn’t mean the market is dead. In fact, this type of environment often sets up the next meaningful move. Traders who stay patient and focused on structure, not noise, are usually the ones ready when the next leg kicks in. The chart may be quiet. But it’s watching. So should we!