Bitcoin Shoots Above $125K – Can the Rally Last?
Bitcoin’s done it again! Another record broken! The world’s biggest cryptocurrency just punched through the $125,000 mark, and that milestone’s got you and I buzzing. It’s been a fast move too, roughly 14% in just a few days, enough to wake up even the quiet corners of the market. A few weeks ago, sentiment was cautious. And now? Everyone’s talking about safe-haven demand, ETF inflows, and whether this time the rally might actually stick.
Technical Drivers
Look at the daily chart and you’ll see it plain as day that buyers are in charge. The trend’s been a clean staircase higher, barely giving back any ground. Bitcoin’s comfortably above all its major moving averages – roughly $114K on the 50-day, about $106K on the 200-day. That’s a healthy cushion.
Support seems to be sitting neatly around $120K, the zone where dips keep finding buyers. If that gives way, there’s another landing spot near $115K, which lines up nicely with the 50-day average. On the flip side, resistance comes in around $125K-$127K, the fresh high that everyone’s watching. A daily close above roughly $126K would probably open the door toward $130K and beyond (although that’s easier said than done).
Momentum-wise, the setup’s firm but not overheated. The RSI shot above 70 during the breakout (overbought territory) but it’s cooled off to the high-60s. That pullback’s actually healthy; it gives the market breathing room. The MACD still leans bullish too – lines are stacked positively, though the histogram’s narrowed a touch. Nothing alarming there, just a sign that the pace is slowing. And that’s fine. Strong trends don’t move in straight lines forever!
Volume tells a similar story. The breakout candle came with real conviction – big inflows, likely from institutions. Since then, activity’s tapered off, but that looks more like profit-taking than panic. Long-term holders don’t seem bothered; in fact, exchange balances are near six-year lows. That’s quietly telling you there’s more holding than dumping happening.
BTC/USD Daily Chart: Moving Averages
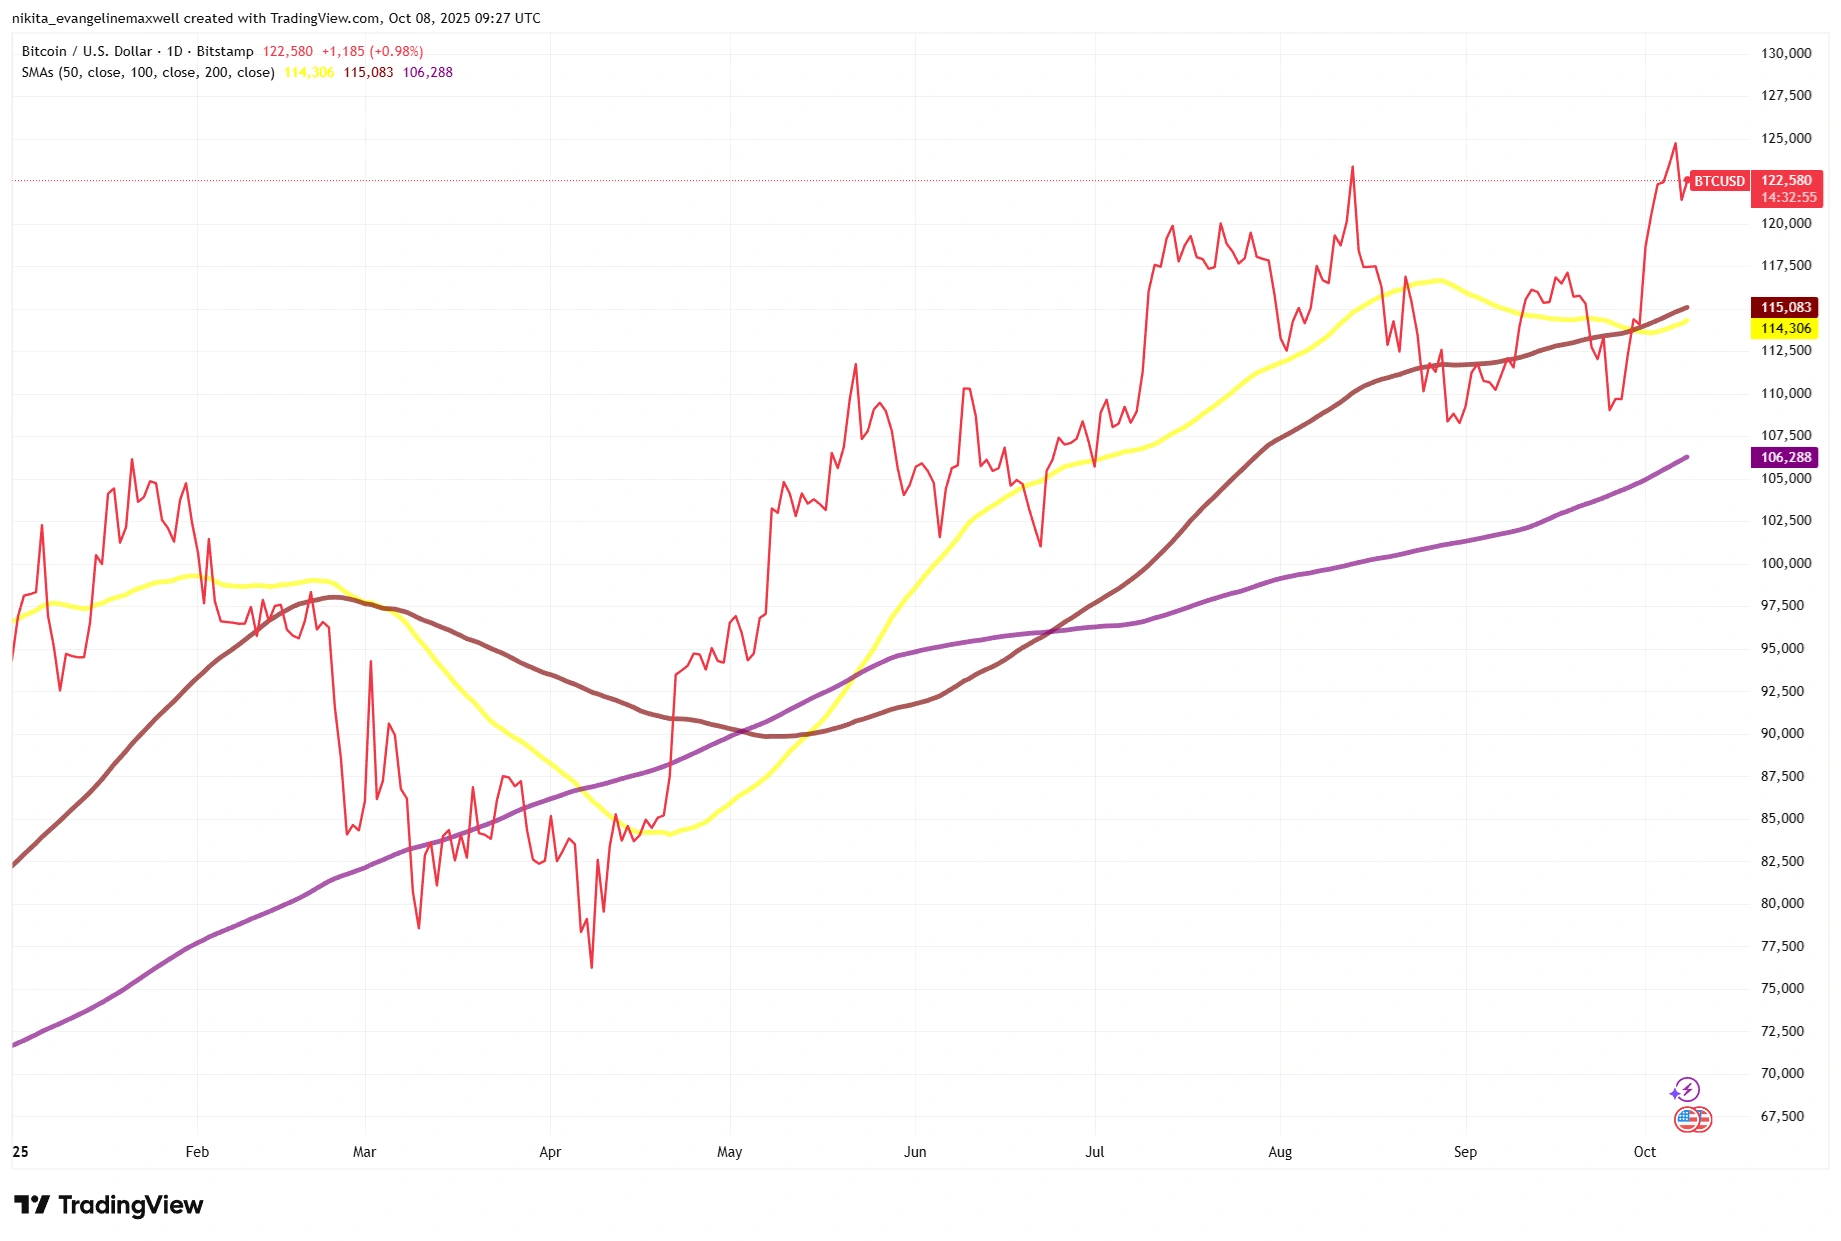
Source: TradingView. All indices are total return in US dollars. Past performance is not a reliable indicator of future performance. Data as of 8 October 2025.
Bitcoin remains well above its key moving averages, with the 50-day recently crossing above the 200-day (“golden cross”), reinforcing the broader uptrend while $120K acts as near-term support.
Momentum & Pattern Watch
Here’s the thing, there’s no clear reversal signal yet. The small pullback from $125K down toward $121K looks more like a pause than a top. The structure on the daily chart almost resembles a flag: tight, sideways, waiting for direction. Buyers are defending the $120K floor, while the ceiling remains $125-$127K. Whichever side gives first will set the next tone.
The momentum indicators still lean bullish. RSI’s well above 50, meaning price and momentum are still in sync. The MACD’s flattening a bit but hasn’t flipped negative, which is another way of saying the trend’s slowing, not reversing.
If Bitcoin clears $126K with conviction, ideally on strong volume, the next logical step is the $130K-$135K zone. That’s where some traders see the next test. On the other hand, slipping below $120K could trigger a quick trip toward $115K. Below that, things get more interesting or messier, depending on how you see it.
BTC/USD Daily Chart: RSI and MACD
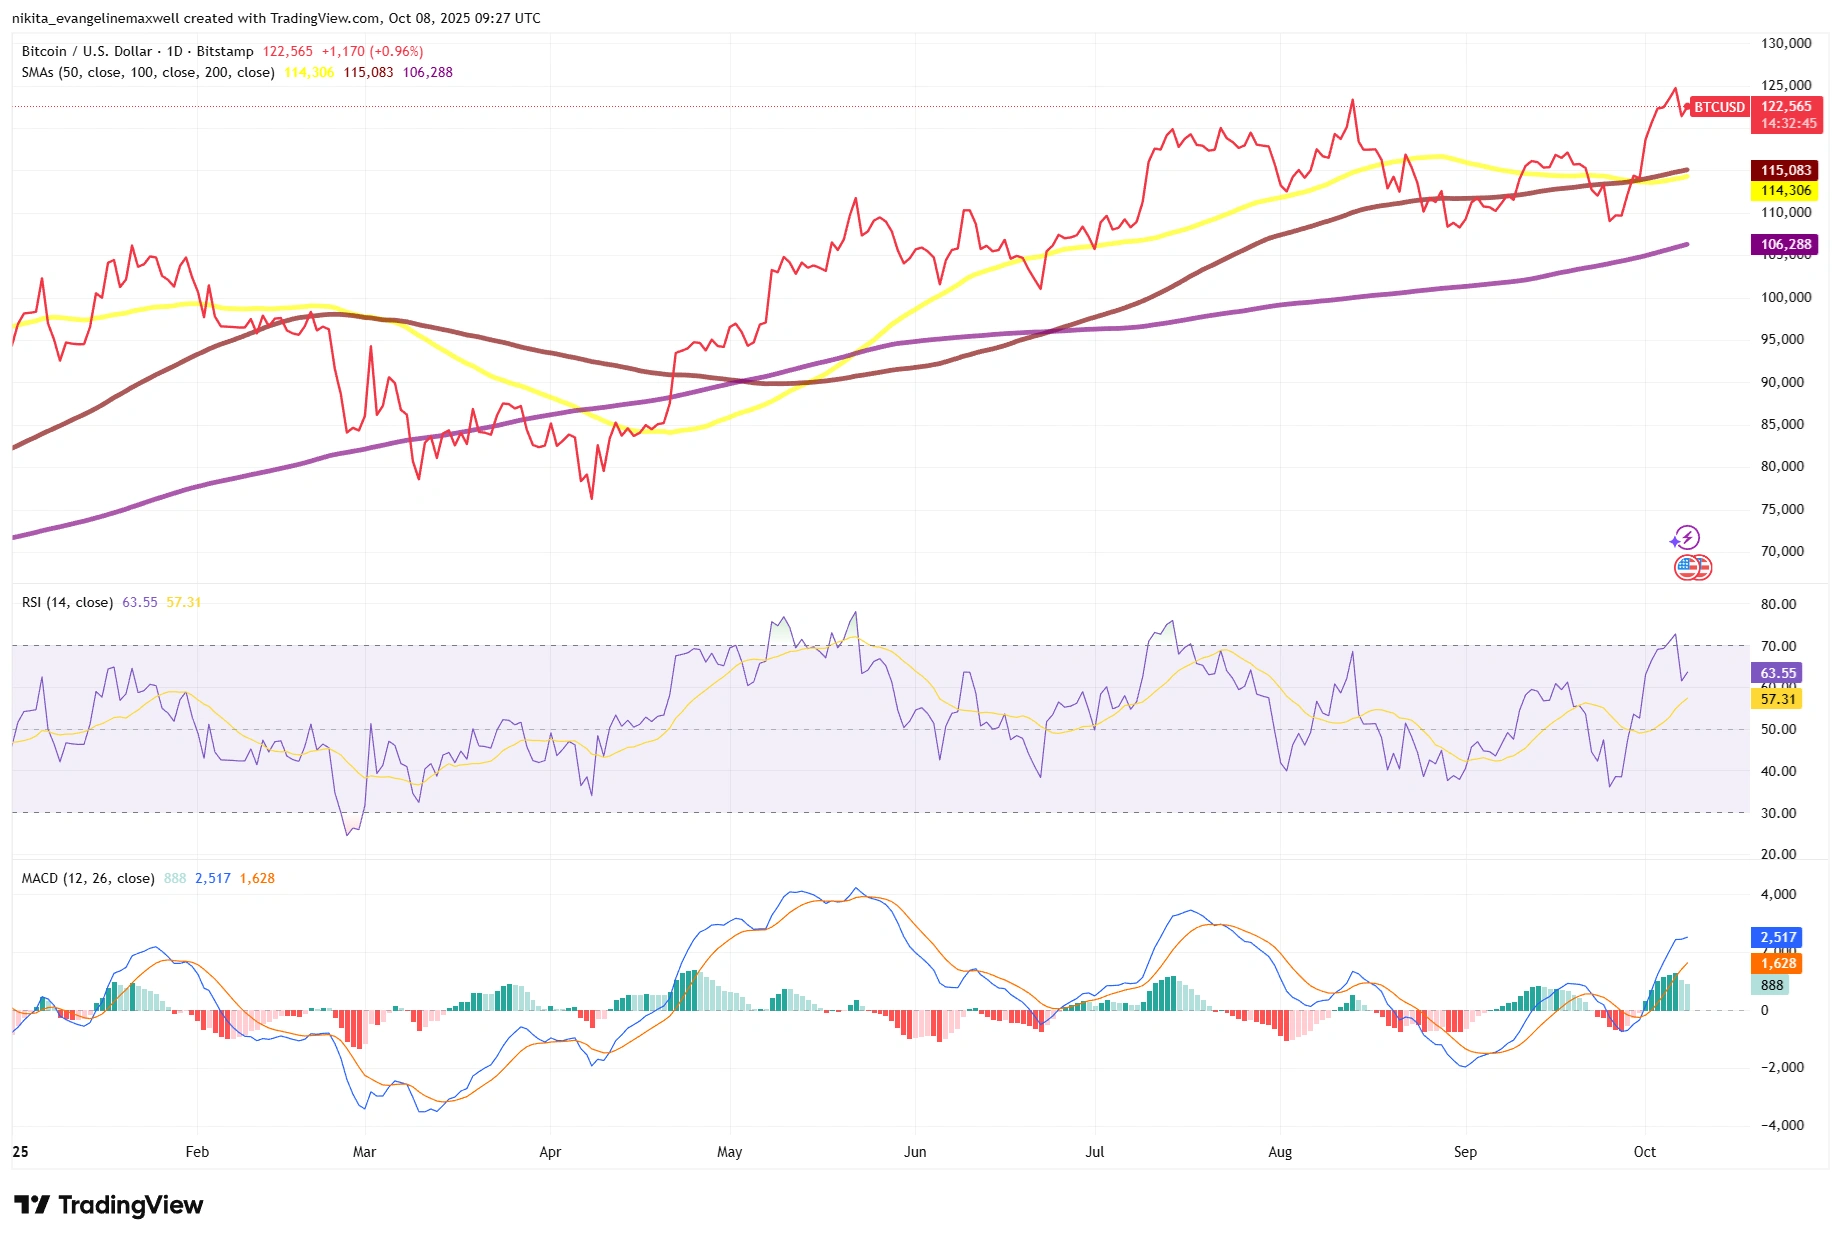
Source: TradingView. All indices are total return in US dollars. Past performance is not a reliable indicator of future performance. Data as of 8 October 2025.
RSI has eased from overbought territory but stays comfortably above 50, while the MACD line continues to trend above its signal – signs of a market pausing, not reversing.
Risks & What Traders Are Watching
Every rally has its cracks. You just don’t notice them until they widen. For Bitcoin, the line to watch is still $115K. Lose that, and the mood changes fast. That level also happens to line up with the rising 50-day MA, so it’s more than just a random number.
Macro-wise, a few catalysts could shake things up. The US CPI data on 15 October is front and centre. A hot print could strengthen the dollar and cool risk appetite. Then you’ve got the Fed and ECB meetings later this month. If policymakers sound more hawkish than expected, it could easily knock crypto sentiment. That said, ETF inflows have been strong, and if that keeps up, it’ll cushion any short-term wobbles.
So yes, Bitcoin’s looking solid, but it’s not bulletproof.
Bottom Line
The uptrend’s alive, just catching its breath. A close above $126K keeps the bulls in charge, while a drop under $120K starts to chip away at that confidence. Below $115K, you’re probably looking at a proper correction. For now, though, Bitcoin’s holding firm, and as long as price and momentum stay aligned, traders will keep giving this rally the benefit of the doubt.