Bitcoin Blasts Past $125K: Can Bulls Keep Control?
Bitcoin’s done it again – shot past the $125,000 mark and shook the market. In just a few days, it’s jumped roughly 14%, sending volatility right back to the levels we haven’t seen in months. The mood’s flipped fast – from cautious to full-on excited – with everyone pointing fingers at ETF inflows, safe-haven demand, and a wave of institutional buying.
But now that the dust’s settled a little, traders are asking the real question: can this rally actually hold up, or is it just another sprint before the next pullback?
What’s Driving the Move
Take a step back, and the story’s pretty clear – Bitcoin’s still in an uptrend. Even after a few wobbles, it’s holding comfortably above the major averages, which shows buyers haven’t lost interest. The shorter-term trend line, sitting around $115K, is still climbing above the longer-term one near $108K – a healthy sign that the broader direction remains upward.
The $120K area has become a key zone to watch. It was the breakout point, and now it’s acting like a floor where buyers tend to show up. If price drifts lower, the next safety net sits closer to $115K, where the uptrend line and moving average meet. On the other side, the $125K to $127K range is the wall in front of the bulls. A strong daily close above that could open the next leg higher, possibly toward $130K, but it’ll take conviction and volume to push through.
Momentum’s cooled down but not reversed. The rally got a bit overheated earlier, but indicators now show a market that’s taking a breather, not rolling over. In plain terms, Bitcoin’s still trending up – just moving at a more natural pace after a sprint.
Volume tells the same story: the big push above $120K came with strength, but trading since then has been calmer, with no signs of panic selling. Long-term holders are staying put – a quiet show of confidence that says this run might still have legs.
BTC/USD Daily Chart – Support & Resistance Zones, 50-/200-Day EMAs
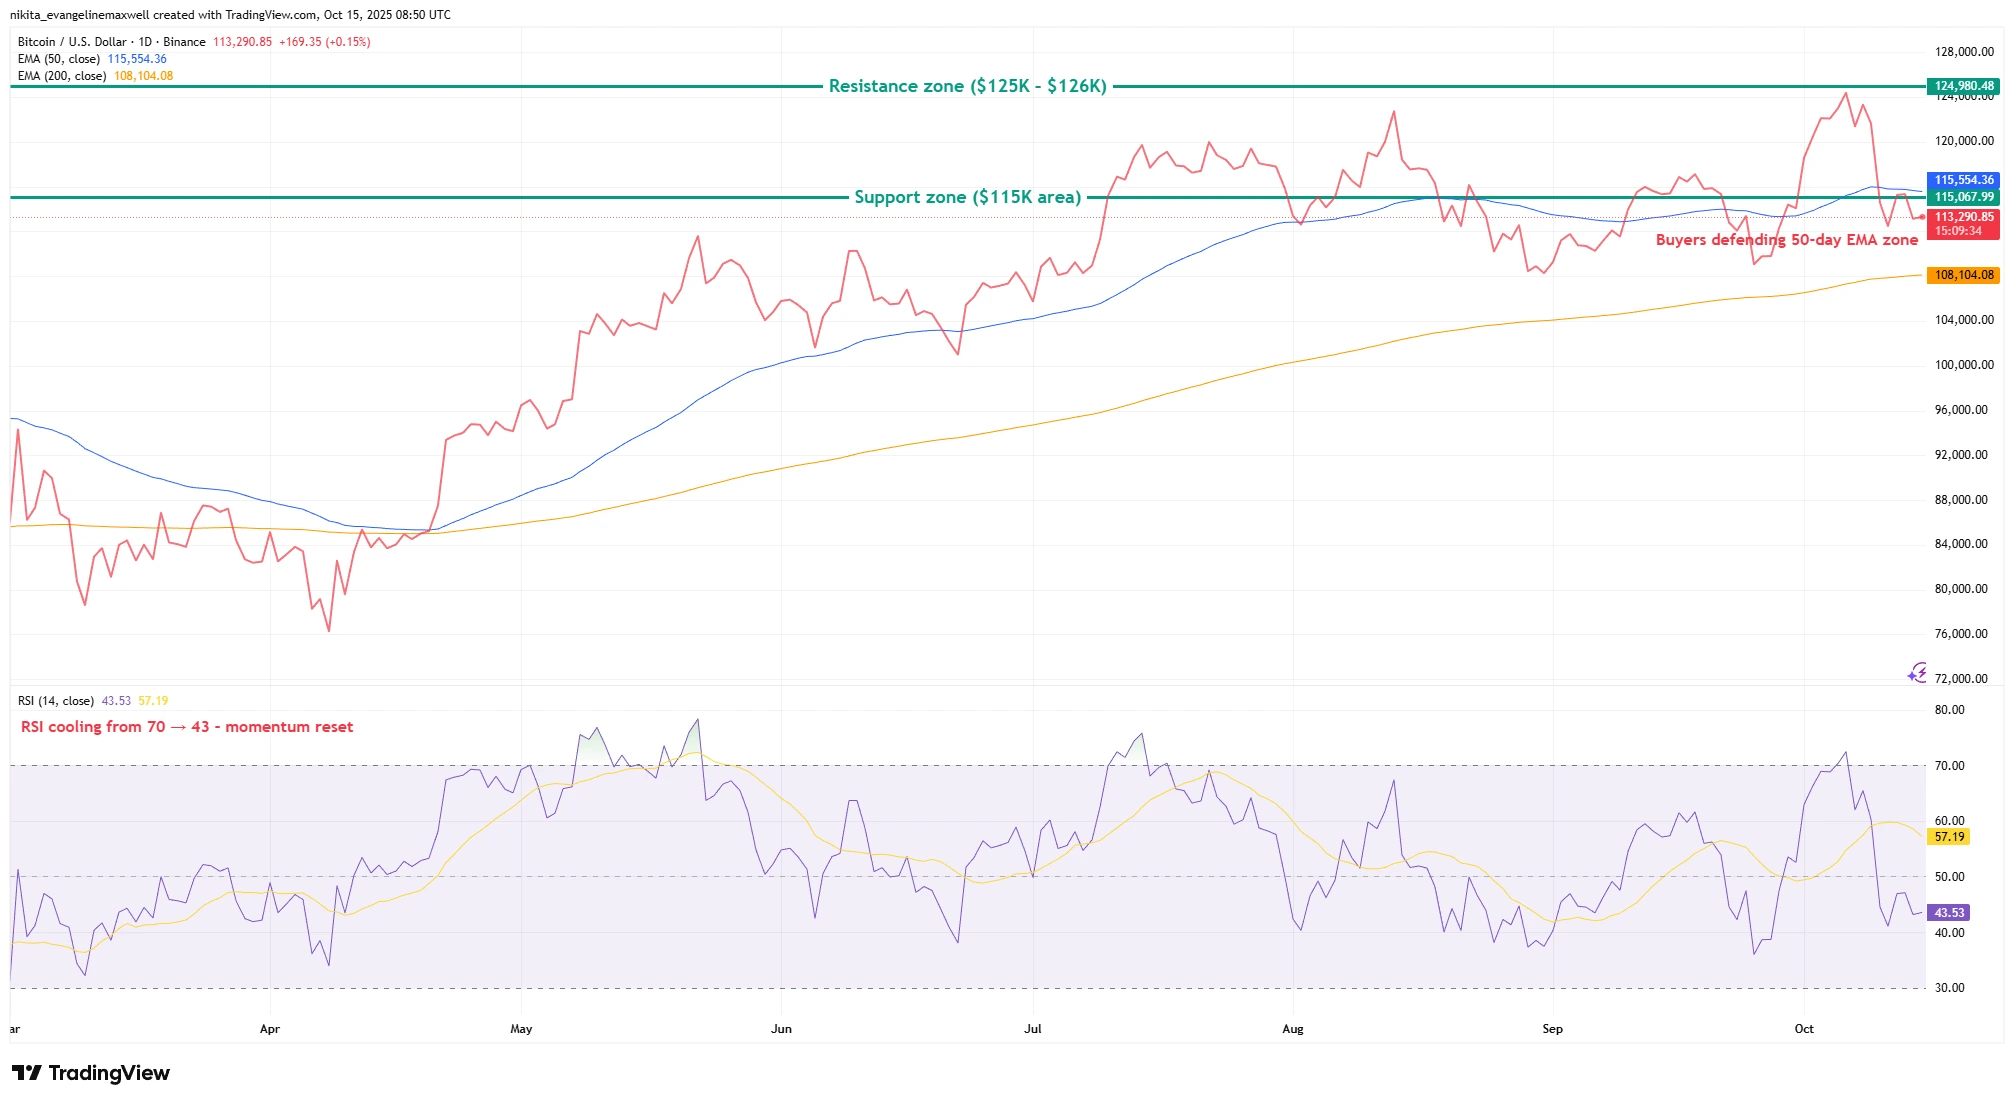
Source: TradingView. All indices are total return in US dollars. Past performance is not a reliable indicator of future performance. Data as of 15 October 2025.
Bitcoin’s broader trend remains intact, with price defending the $115 K area near the 50-day EMA. Momentum has cooled from overbought (RSI 70 to RSI 43), signalling a healthy reset rather than a reversal.
Momentum & Pattern Watch
So far, this doesn’t look like a market that’s topping out – more like one catching its breath. The pullback from the highs has been calm and orderly, more of a pause than a panic.
Momentum still leans in favour of the bulls. The main strength gauges have cooled from their peaks but remain comfortably positive, showing balance. The overall trend of higher lows is intact, which tells us confidence hasn’t cracked yet.
The range is fairly clear: buyers are defending the lower end, while sellers keep a lid near the recent highs. If Bitcoin manages to break above that ceiling with solid momentum, it could easily invite another leg higher. But if it slips below the lower zone, that would suggest the rally’s losing energy and might need a deeper reset before trying again.
BTC/USD 4-Hour Chart – Support Retest & Short-Term Momentum
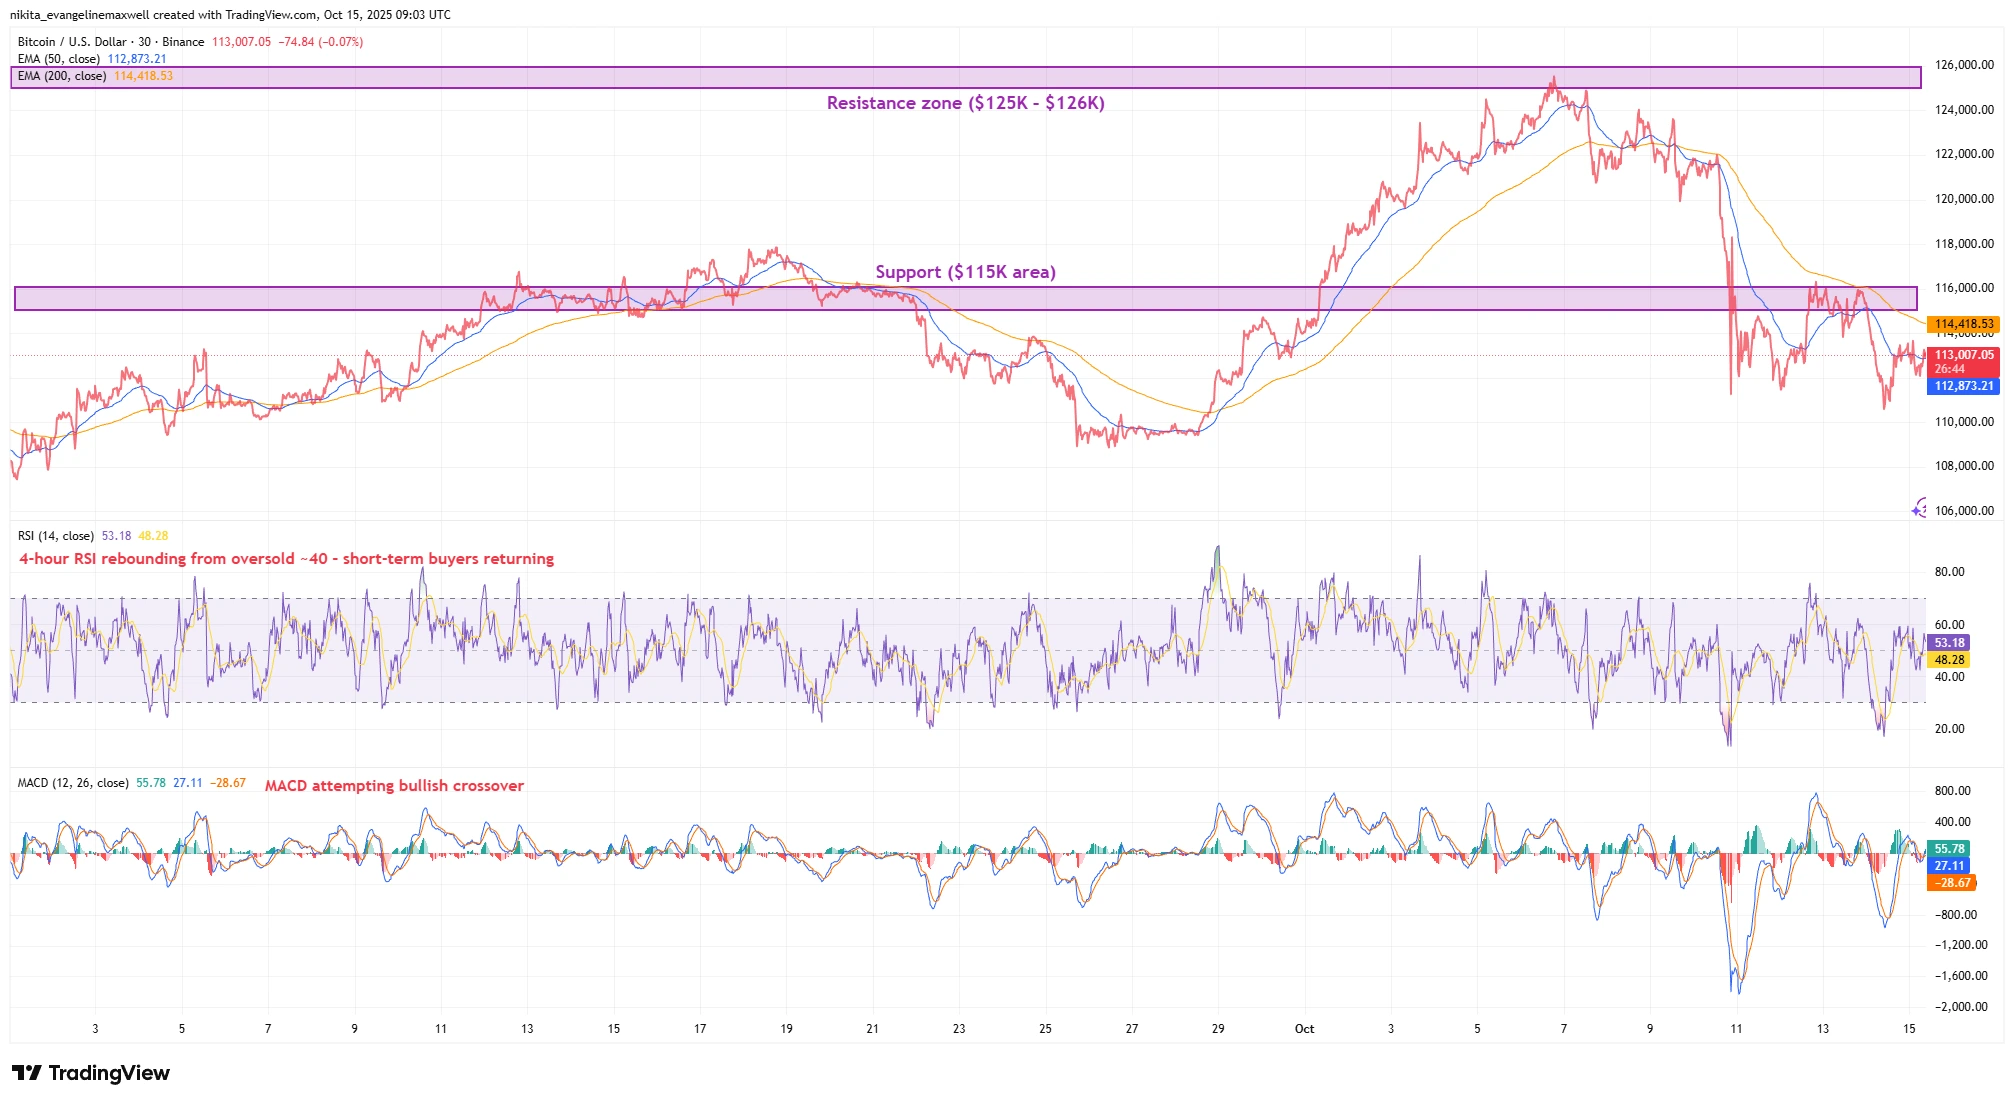
Source: TradingView. All indices are total return in US dollars. Past performance is not a reliable indicator of future performance. Data as of 15 October 2025.
Bitcoin’s 4-hour RSI has rebounded from oversold (~40) while the MACD attempts a bullish crossover – hinting that short-term buyers are returning near the $115K support zone.
Risks & What Traders Are Watching
For now, the line everyone’s watching sits near $115K. If Bitcoin holds above it, the uptrend story stays intact. But if it slips below and can’t bounce back, that’s when traders start to wonder if the rally’s running out of fuel.
Beyond the charts, a few big events could shake things up. The US inflation report today is front and centre, a hotter reading could lift the dollar and cool demand for risk assets like crypto, while a softer one might give Bitcoin a boost.
Later in the month, the Fed and ECB meetings could also sway sentiment, especially if policymakers sound more cautious. And finally, ETF inflows remain a key pillar (strong demand there keeps the bull case alive).
Bitcoin vs US Dollar Index (DXY) – Normalised Performance & Momentum
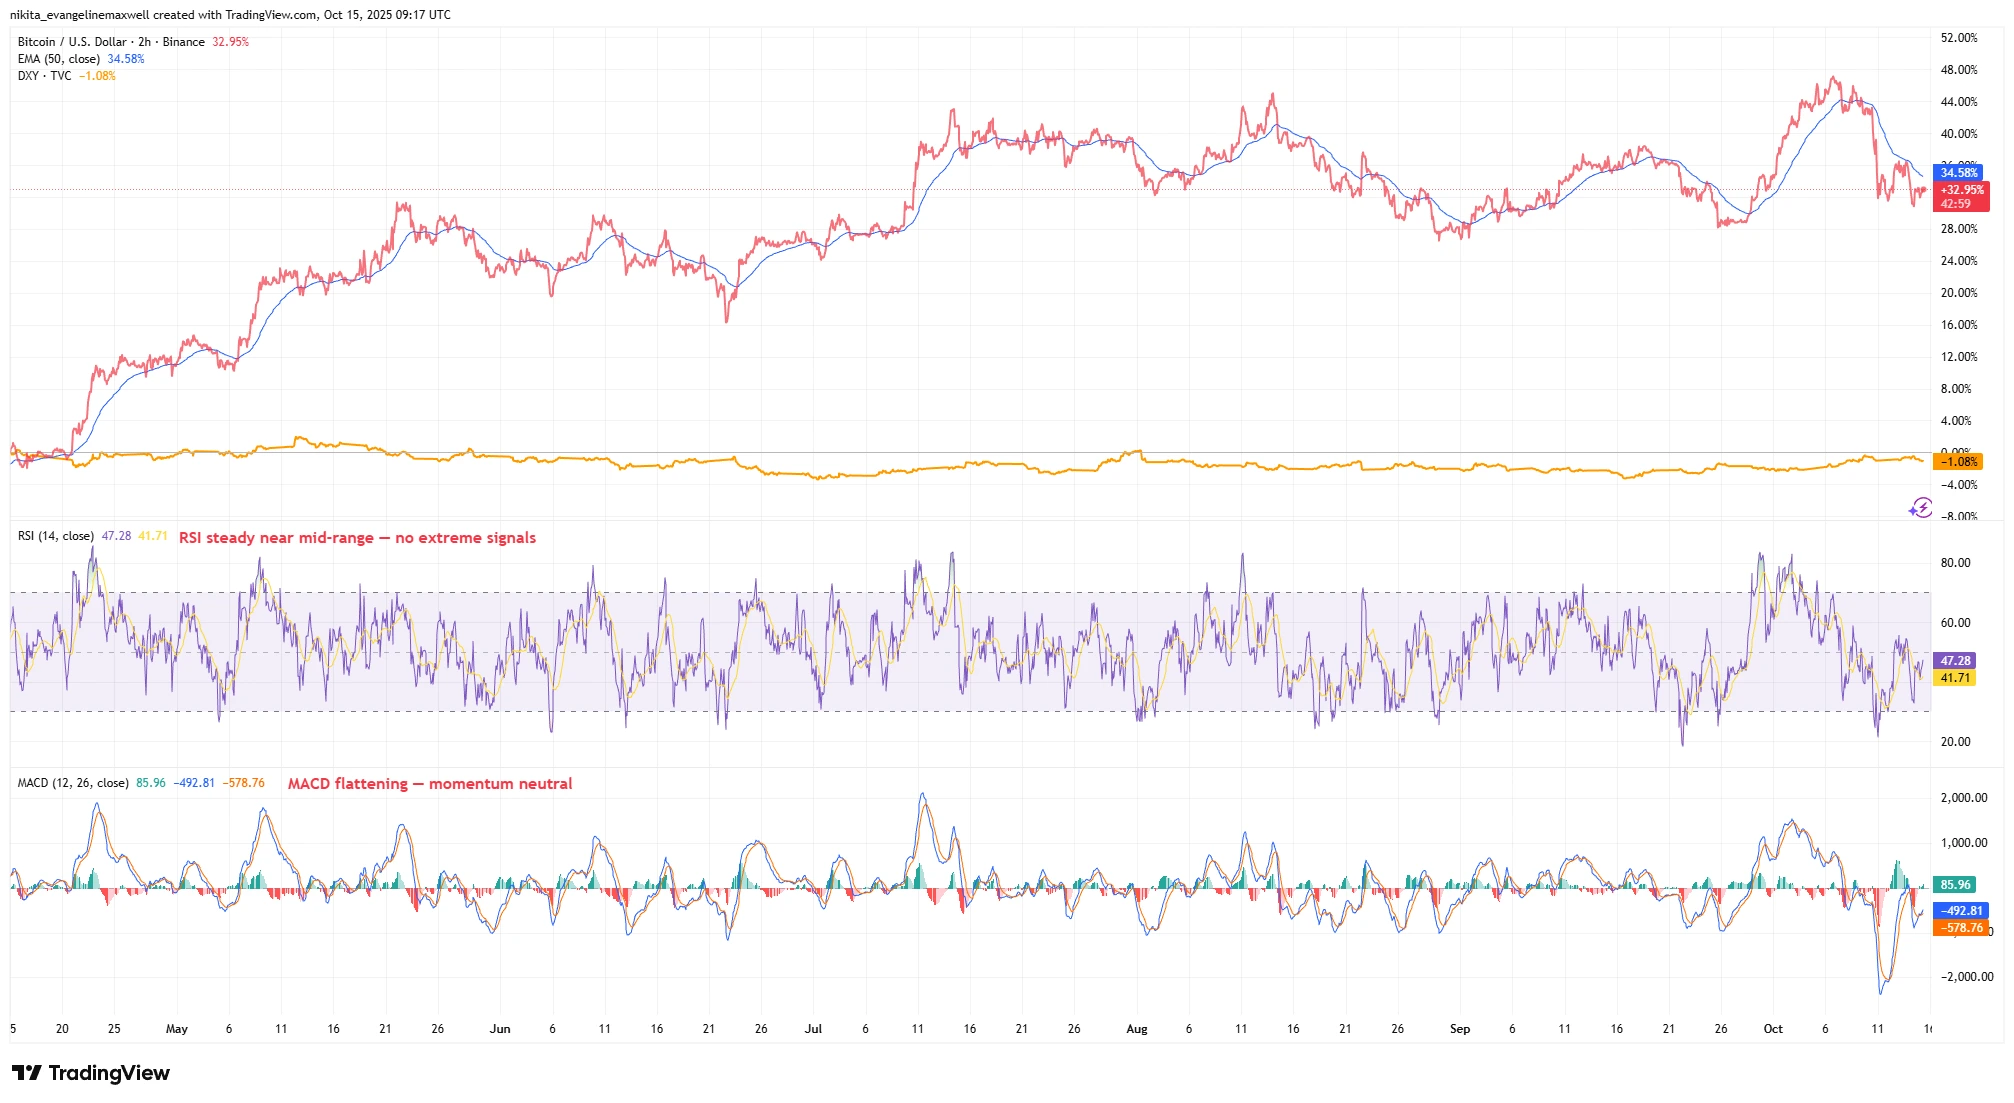
Source: TradingView. All indices are total return in US dollars. Past performance is not a reliable indicator of future performance. Data as of 15 October 2025.
Bitcoin (+33 %) has outperformed the US Dollar Index (−1%) over the past six months, while RSI and MACD both sit near neutral levels. The contrast highlights how Bitcoin often gains as the dollar softens.
Bottom Line
Bitcoin’s trend is still up, but the market’s clearly at a crossroads. A decisive close above $126K would confirm that bulls remain in control and open the door toward $130K+, while a fall below $115K would suggest the rally’s fading.
Until then, it’s a waiting game inside that $115K-$125K range – a market that’s strong, but catching its breath.